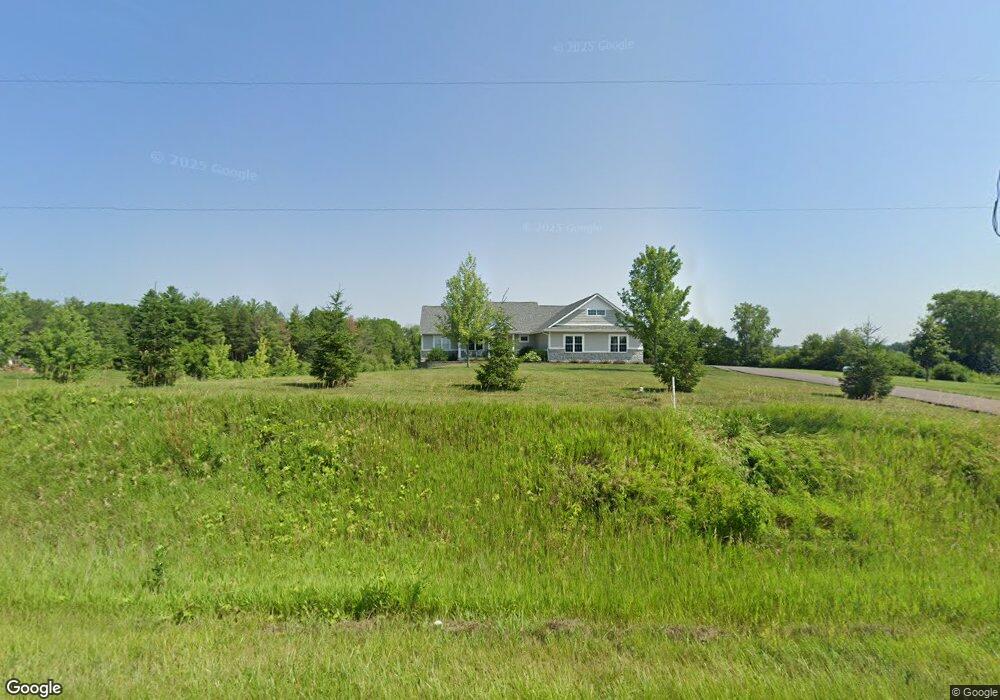
11964 SE 64th Ave Runnells, IA 50237
Estimated Value: $585,000 - $818,000
3
Beds
4
Baths
2,134
Sq Ft
$343/Sq Ft
Est. Value
About This Home
This home is located at 11964 SE 64th Ave, Runnells, IA 50237 and is currently estimated at $731,013, approximately $342 per square foot. 11964 SE 64th Ave is a home with nearby schools including Runnells Elementary School, Southeast Polk Spring Creek- 6th Grade, and Southeast Polk Junior High School.
Ownership History
Date
Name
Owned For
Owner Type
Purchase Details
Closed on
Apr 5, 2023
Sold by
Ball Brian Keith
Bought by
Ball Ashley Michael and Ball Brian K
Current Estimated Value
Purchase Details
Closed on
Nov 13, 2016
Sold by
Ewing Sean E and Ewing Catherine
Bought by
Ball Brian
Purchase Details
Closed on
Mar 31, 2014
Sold by
Burch Joseph and Burch Michaela
Bought by
Ewing Sean E
Purchase Details
Closed on
Aug 13, 2012
Sold by
Burch Joseph and Burch Mihaela
Bought by
Burch Joseph and Burch Mihaela
Home Financials for this Owner
Home Financials are based on the most recent Mortgage that was taken out on this home.
Original Mortgage
$49,600
Interest Rate
3.83%
Purchase Details
Closed on
Jun 22, 2012
Sold by
Evans Terry Lee and Evans Terry L
Bought by
Burch Joe P
Home Financials for this Owner
Home Financials are based on the most recent Mortgage that was taken out on this home.
Original Mortgage
$49,600
Interest Rate
3.83%
Create a Home Valuation Report for This Property
The Home Valuation Report is an in-depth analysis detailing your home's value as well as a comparison with similar homes in the area
Home Values in the Area
Average Home Value in this Area
Purchase History
| Date | Buyer | Sale Price | Title Company |
|---|---|---|---|
| Ball Ashley Michael | -- | -- | |
| Ball Brian | $85,000 | None Available | |
| Ewing Sean E | $74,125 | None Available | |
| Burch Joseph | -- | None Available | |
| Burch Joe P | $61,500 | None Available |
Source: Public Records
Mortgage History
| Date | Status | Borrower | Loan Amount |
|---|---|---|---|
| Previous Owner | Burch Joe P | $49,600 |
Source: Public Records
Tax History Compared to Growth
Tax History
| Year | Tax Paid | Tax Assessment Tax Assessment Total Assessment is a certain percentage of the fair market value that is determined by local assessors to be the total taxable value of land and additions on the property. | Land | Improvement |
|---|---|---|---|---|
| 2025 | $10,166 | $804,400 | $119,600 | $684,800 |
| 2024 | $10,166 | $704,810 | $99,110 | $605,700 |
| 2023 | $9,512 | $711,100 | $105,400 | $605,700 |
| 2022 | $9,388 | $560,400 | $87,500 | $472,900 |
| 2021 | $7,828 | $560,400 | $87,500 | $472,900 |
| 2020 | $7,714 | $445,300 | $78,000 | $367,300 |
| 2019 | $7,278 | $445,300 | $78,000 | $367,300 |
| 2018 | $862 | $403,500 | $68,800 | $334,700 |
| 2017 | $64 | $50,100 | $50,100 | $0 |
| 2016 | $64 | $3,250 | $3,250 | $0 |
| 2015 | $64 | $3,250 | $3,250 | $0 |
| 2014 | $64 | $3,250 | $3,250 | $0 |
Source: Public Records
Map
Nearby Homes
- 12028 SE 64th Ave
- 502 Brown St
- 203 Brown St
- 22955 Buchanan Trail
- 10579 W 129th St S
- 3380 SE 96th St
- 3320 SE 96th St
- 3333 220th Ave
- 10641 SE 6th Ave
- 1200 SE 92nd St
- 7930 SE Vandalia Dr
- 3350 SE 82nd St
- 00 Highway 5
- 7820 SE Vandalia Dr
- 2496 SE 83rd Ct
- 118 Dubuque St
- 3356 SE 82nd St
- 2511 SE 82nd St
- 24479 Elthon Place
- 7295 SE Vandalia Dr
- 0000 SE 64th Ave
- 11900 SE 64th Ave
- 11960 SE 64th Ave
- 12480 SE 64th Ave
- 12026 SE 64th Ave
- 11753 SE 64th Ave
- 11888 SE 64th Ave
- 11816 SE 64th Ave
- 11787 SE 64th Ave
- 6645 SE 120th St
- 11729 SE 64th Ave
- 12203 SE 64th Ave
- 6801 SE 120th St
- 6855 SE 120th St
- 12180 SE 64th Ave
- 12200 SE 64th Ave
- 6900 SE 120th St
- 6945 SE 120th St
- 7060 SE 120th St
- 12304 SE 64th Ave