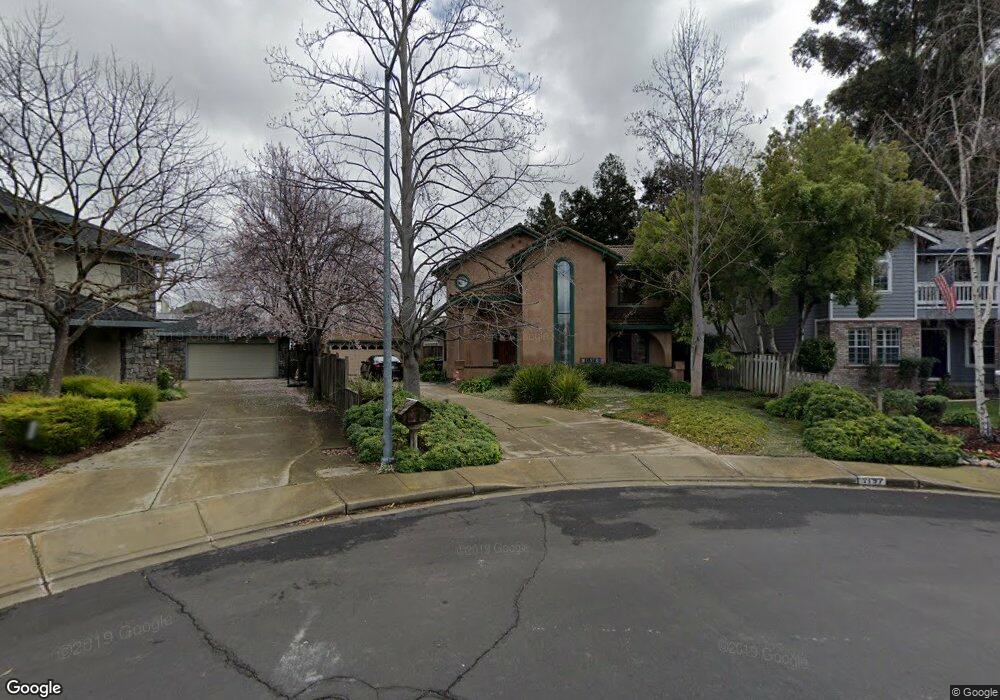
1197 Sherry Way Livermore, CA 94550
Estimated Value: $1,641,348 - $1,934,000
4
Beds
3
Baths
3,055
Sq Ft
$573/Sq Ft
Est. Value
About This Home
This home is located at 1197 Sherry Way, Livermore, CA 94550 and is currently estimated at $1,749,337, approximately $572 per square foot. 1197 Sherry Way is a home located in Alameda County with nearby schools including East Avenue Middle School, Livermore High School, and St Michael's School.
Ownership History
Date
Name
Owned For
Owner Type
Purchase Details
Closed on
Jan 13, 2025
Sold by
James E Kervin Trust and Kervin James E
Bought by
Kervin James E
Current Estimated Value
Purchase Details
Closed on
Aug 2, 2024
Sold by
Kervin Margaret L and Kervin James E
Bought by
Kervin Family Trust and Kervin
Purchase Details
Closed on
Jul 5, 2013
Sold by
Kervin James E
Bought by
Kervin James E and The James E Kervin Trust
Purchase Details
Closed on
Jan 31, 1994
Sold by
Kervin James E and Bondurant Peggy L
Bought by
Kervin James E and Bondurant Peggy L
Home Financials for this Owner
Home Financials are based on the most recent Mortgage that was taken out on this home.
Original Mortgage
$324,000
Interest Rate
7.19%
Create a Home Valuation Report for This Property
The Home Valuation Report is an in-depth analysis detailing your home's value as well as a comparison with similar homes in the area
Home Values in the Area
Average Home Value in this Area
Purchase History
| Date | Buyer | Sale Price | Title Company |
|---|---|---|---|
| Kervin James E | -- | None Listed On Document | |
| Kervin Family Trust | -- | None Listed On Document | |
| Kervin Family Trust | -- | None Listed On Document | |
| Kervin Margaret L | -- | None Listed On Document | |
| Kervin James E | -- | None Available | |
| Kervin James E | -- | North American Title Company |
Source: Public Records
Mortgage History
| Date | Status | Borrower | Loan Amount |
|---|---|---|---|
| Previous Owner | Kervin James E | $324,000 |
Source: Public Records
Tax History Compared to Growth
Tax History
| Year | Tax Paid | Tax Assessment Tax Assessment Total Assessment is a certain percentage of the fair market value that is determined by local assessors to be the total taxable value of land and additions on the property. | Land | Improvement |
|---|---|---|---|---|
| 2025 | $9,334 | $735,909 | $222,929 | $519,980 |
| 2024 | $9,334 | $721,344 | $218,558 | $509,786 |
| 2023 | $9,196 | $714,064 | $214,273 | $499,791 |
| 2022 | $9,066 | $693,065 | $210,072 | $489,993 |
| 2021 | $8,140 | $679,340 | $205,954 | $480,386 |
| 2020 | $8,626 | $679,304 | $203,842 | $475,462 |
| 2019 | $8,664 | $665,986 | $199,846 | $466,140 |
| 2018 | $8,481 | $652,929 | $195,928 | $457,001 |
| 2017 | $8,266 | $640,129 | $192,087 | $448,042 |
| 2016 | $7,964 | $627,579 | $188,321 | $439,258 |
| 2015 | $7,471 | $618,154 | $185,493 | $432,661 |
| 2014 | $7,341 | $606,047 | $181,860 | $424,187 |
Source: Public Records
Map
Nearby Homes
- 1153 Sherry Way
- 2211 College Ave
- 1324 Chateau Common Unit 206
- 772 Mcleod St
- 2602 Lucca Ct
- 1909 De Vaca Way
- 3283 East Ave
- 3732 Carrigan Common
- 1004 Vienna St
- 1810 Peary Way
- 2878 4th St Unit 1401
- 1623 4th St
- 3491 Madeira Way
- 1727 2nd St
- 3857 Pestana Way
- 2908 Worthing Common
- 1467 Hudson Way
- 1948 Railroad Ave Unit 104
- 161 N L St Unit 101
- 3877 Santa Clara Way
- 1189 Sherry Way
- 1196 Sherry Way
- 1182 Sherry Way
- 2610 Chablis Way
- 1215 S Tokay Cm Ave
- 2654 Chablis Way
- 1137 Tokay Common
- 1171 Sherry Way
- 1125 Tokay Common
- 2562 Chablis Way
- 1145 Tokay Common
- 1170 Sherry Way
- 2686 Chablis Way
- 1149 Tokay Common
- 1165 Sherry Way
- 1113 Tokay Common
- 2593 College Ave
- 1153 Riesling Cir
- 1155 Riesling Cir
- 1151 Tokay Common