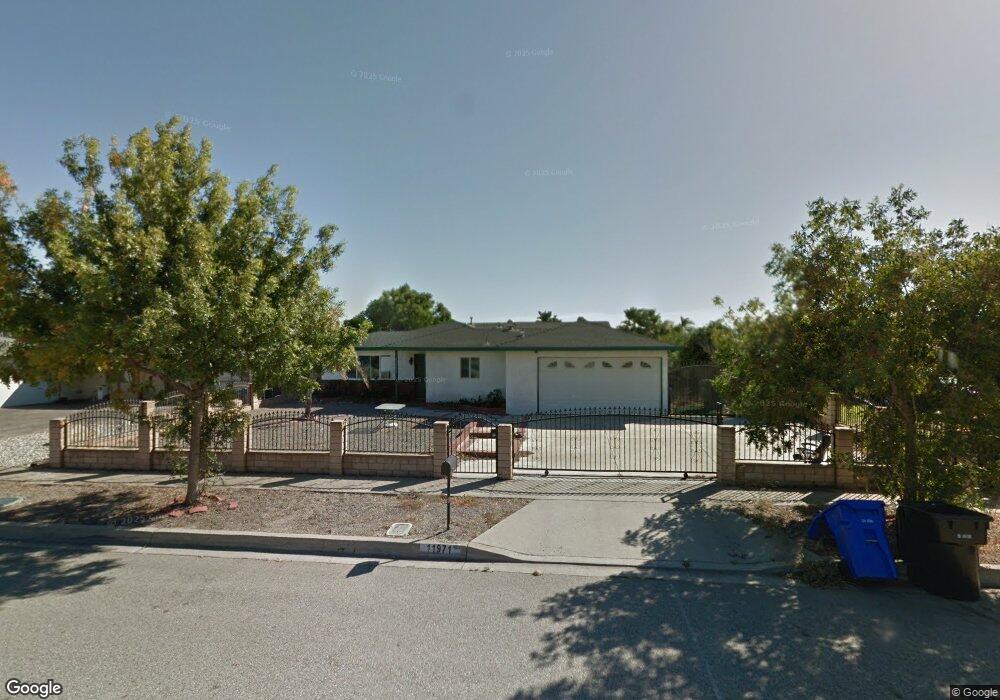
11971 Ashford St Rancho Cucamonga, CA 91739
Victoria NeighborhoodEstimated Value: $669,000 - $731,000
3
Beds
2
Baths
1,630
Sq Ft
$428/Sq Ft
Est. Value
About This Home
This home is located at 11971 Ashford St, Rancho Cucamonga, CA 91739 and is currently estimated at $696,939, approximately $427 per square foot. 11971 Ashford St is a home located in San Bernardino County with nearby schools including Terra Vista Elementary, Etiwanda Intermediate, and Rancho Cucamonga High School.
Ownership History
Date
Name
Owned For
Owner Type
Purchase Details
Closed on
Oct 1, 2009
Sold by
Aurora Loan Services Llc
Bought by
Blevins Twyla J
Current Estimated Value
Home Financials for this Owner
Home Financials are based on the most recent Mortgage that was taken out on this home.
Original Mortgage
$236,558
Interest Rate
5.01%
Mortgage Type
FHA
Purchase Details
Closed on
May 20, 2009
Sold by
Palmerin Gerardo
Bought by
Aurora Loan Services Llc
Purchase Details
Closed on
Feb 8, 2006
Sold by
Adams Antonia G
Bought by
Palmerin Gerardo
Home Financials for this Owner
Home Financials are based on the most recent Mortgage that was taken out on this home.
Original Mortgage
$89,800
Interest Rate
6.25%
Mortgage Type
Stand Alone Second
Purchase Details
Closed on
Aug 19, 2004
Sold by
Adams David W
Bought by
Adams Antonia G
Create a Home Valuation Report for This Property
The Home Valuation Report is an in-depth analysis detailing your home's value as well as a comparison with similar homes in the area
Home Values in the Area
Average Home Value in this Area
Purchase History
| Date | Buyer | Sale Price | Title Company |
|---|---|---|---|
| Blevins Twyla J | $221,500 | Lsi Title Company Ca | |
| Aurora Loan Services Llc | $393,808 | None Available | |
| Palmerin Gerardo | $449,000 | Old Republic Title | |
| Adams Antonia G | -- | -- |
Source: Public Records
Mortgage History
| Date | Status | Borrower | Loan Amount |
|---|---|---|---|
| Previous Owner | Blevins Twyla J | $236,558 | |
| Previous Owner | Palmerin Gerardo | $89,800 | |
| Previous Owner | Palmerin Gerardo | $359,200 |
Source: Public Records
Tax History Compared to Growth
Tax History
| Year | Tax Paid | Tax Assessment Tax Assessment Total Assessment is a certain percentage of the fair market value that is determined by local assessors to be the total taxable value of land and additions on the property. | Land | Improvement |
|---|---|---|---|---|
| 2025 | $3,048 | $285,919 | $99,395 | $186,524 |
| 2024 | $3,048 | $280,313 | $97,446 | $182,867 |
| 2023 | $2,978 | $274,816 | $95,535 | $179,281 |
| 2022 | $2,946 | $269,428 | $93,662 | $175,766 |
| 2021 | $2,896 | $264,145 | $91,825 | $172,320 |
| 2020 | $2,857 | $261,436 | $90,883 | $170,553 |
| 2019 | $2,778 | $256,310 | $89,101 | $167,209 |
| 2018 | $2,771 | $251,284 | $87,354 | $163,930 |
| 2017 | $2,644 | $246,357 | $85,641 | $160,716 |
| 2016 | $2,569 | $241,527 | $83,962 | $157,565 |
| 2015 | $2,551 | $237,899 | $82,701 | $155,198 |
| 2014 | $2,474 | $233,239 | $81,081 | $152,158 |
Source: Public Records
Map
Nearby Homes
- 7809 Danbury Dr
- 7705 Chambray Place Unit 3
- 7676 Papyrus Place Unit 2
- 12247 Chorus Dr
- 7694 Lisbon Place Unit 6
- 7459 Solstice Place
- 7449 Solstice Place
- 7384 Solstice Place
- 7397 Solstice Place
- 7431 Starfire Place
- 7358 Freedom Place
- 12393 Meritage Ct
- 7343 Legacy Place
- 11450 Church St Unit 167
- 7425 Estancia Ct
- 12632 Chimney Rock Dr
- 7353 Ellena W Unit 3
- 7139 Scalea Place
- 11318 Fitzpatrick Dr
- 7271 Venosa Place
- 11981 Ashford St
- 11959 Ashford St
- 11960 Norwick St
- 11982 Norwick St
- 11949 Ashford St
- 11991 Ashford St
- 11972 Ashford St
- 11950 Norwick St
- 11992 Norwick St
- 11960 Ashford St
- 11982 Ashford St
- 12001 Ashford St
- 11939 Ashford St
- 11994 Ashford St
- 11950 Ashford St
- 11940 Norwick St
- 12002 Norwick St
- 11969 Hemlock St
- 11971 Norwick St
- 12002 Ashford St