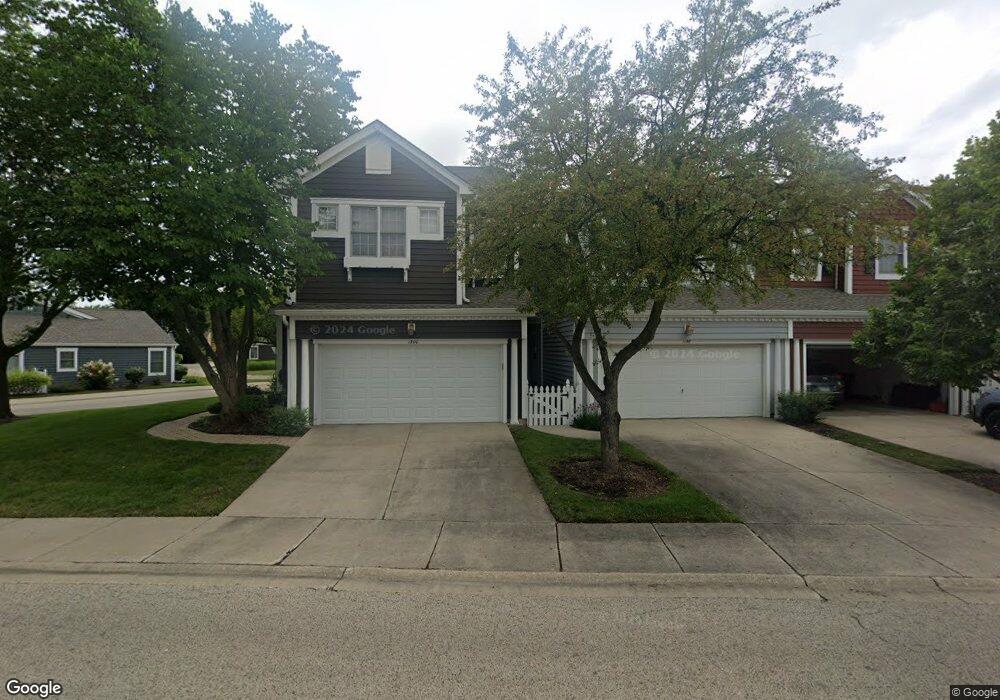
1198 Mount Vernon Dr Unit B Grayslake, IL 60030
Estimated Value: $298,000 - $327,000
3
Beds
3
Baths
1,604
Sq Ft
$192/Sq Ft
Est. Value
About This Home
This home is located at 1198 Mount Vernon Dr Unit B, Grayslake, IL 60030 and is currently estimated at $307,307, approximately $191 per square foot. 1198 Mount Vernon Dr Unit B is a home located in Lake County with nearby schools including Frederick School, Avon Center Elementary School, and Grayslake Middle School.
Ownership History
Date
Name
Owned For
Owner Type
Purchase Details
Closed on
Jun 14, 2007
Sold by
Wyrick Cynthia
Bought by
Sharken Linda
Current Estimated Value
Home Financials for this Owner
Home Financials are based on the most recent Mortgage that was taken out on this home.
Original Mortgage
$155,000
Outstanding Balance
$94,895
Interest Rate
6.2%
Mortgage Type
Unknown
Estimated Equity
$212,412
Purchase Details
Closed on
Oct 7, 2004
Sold by
Anderson Carl E and Anderson Peggy M
Bought by
Wyrick Cynthia
Home Financials for this Owner
Home Financials are based on the most recent Mortgage that was taken out on this home.
Original Mortgage
$128,000
Interest Rate
5.37%
Mortgage Type
Purchase Money Mortgage
Purchase Details
Closed on
Oct 23, 1995
Sold by
Bank One Chicago Na
Bought by
Anderson Carl E and Anderson Peggy M
Home Financials for this Owner
Home Financials are based on the most recent Mortgage that was taken out on this home.
Original Mortgage
$103,900
Interest Rate
6.37%
Create a Home Valuation Report for This Property
The Home Valuation Report is an in-depth analysis detailing your home's value as well as a comparison with similar homes in the area
Home Values in the Area
Average Home Value in this Area
Purchase History
| Date | Buyer | Sale Price | Title Company |
|---|---|---|---|
| Sharken Linda | $210,000 | Lawyers | |
| Wyrick Cynthia | $218,000 | Ticor | |
| Anderson Carl E | $110,000 | Ticor Title Insurance Compan |
Source: Public Records
Mortgage History
| Date | Status | Borrower | Loan Amount |
|---|---|---|---|
| Open | Sharken Linda | $155,000 | |
| Previous Owner | Wyrick Cynthia | $128,000 | |
| Previous Owner | Anderson Carl E | $103,900 |
Source: Public Records
Tax History Compared to Growth
Tax History
| Year | Tax Paid | Tax Assessment Tax Assessment Total Assessment is a certain percentage of the fair market value that is determined by local assessors to be the total taxable value of land and additions on the property. | Land | Improvement |
|---|---|---|---|---|
| 2024 | $7,818 | $81,165 | $8,230 | $72,935 |
| 2023 | $6,909 | $74,490 | $7,553 | $66,937 |
| 2022 | $6,909 | $63,632 | $3,916 | $59,716 |
| 2021 | $6,819 | $61,161 | $3,764 | $57,397 |
| 2020 | $6,804 | $58,193 | $3,581 | $54,612 |
| 2019 | $6,561 | $55,832 | $3,436 | $52,396 |
| 2018 | $7,157 | $58,973 | $6,303 | $52,670 |
| 2017 | $7,355 | $58,974 | $5,929 | $53,045 |
| 2016 | $7,038 | $54,439 | $5,473 | $48,966 |
| 2015 | $6,837 | $49,734 | $5,000 | $44,734 |
| 2014 | $5,993 | $44,070 | $2,827 | $41,243 |
| 2012 | $5,926 | $46,026 | $2,952 | $43,074 |
Source: Public Records
Map
Nearby Homes
- 303 Mainsail Dr
- 1045 Manchester Cir
- 33978 N Lake Rd
- 873 Essex Cir
- 34871 N Lake Shore Dr
- 7736 Geneva Dr
- 707 Crossland Dr
- 34271 N Tangueray Dr
- 820 Amelia Ct
- 33762 N Oak St
- 18587 W Meander Dr
- 699 Snow Cap Ct
- 18564 W Main St
- 968 Knowles Rd
- 80 N Lake Ave
- 528 Cliffwood Ln
- 33670 N Lake Shore Dr
- 745 Dillon Ct
- 355 Buckingham Dr
- 20295 W Washington St
- 1196 Mount Vernon Dr Unit C
- 1200 Mount Vernon Dr Unit A
- 1194 Mount Vernon Dr Unit D
- 1192 Mount Vernon Dr Unit E
- 950 Mount Vernon Dr Unit A
- 1190 Mount Vernon Dr Unit A
- 952 Mount Vernon Dr Unit B
- 1188 Mount Vernon Dr Unit B
- 954 Mount Vernon Dr Unit C
- 1186 Mount Vernon Dr Unit C
- 956 Mount Vernon Dr Unit D
- 957 Mckay Cir Unit C
- 1184 Mount Vernon Dr Unit D
- 1184 Mount Vernon Dr Unit 1184
- 959 Mckay Cir Unit B
- 960 Mount Vernon Dr
- 961 Mckay Cir Unit A
- 1182 Mount Vernon Dr Unit E
- 991 Carriage Ln
- 971 Mckay Cir Unit D