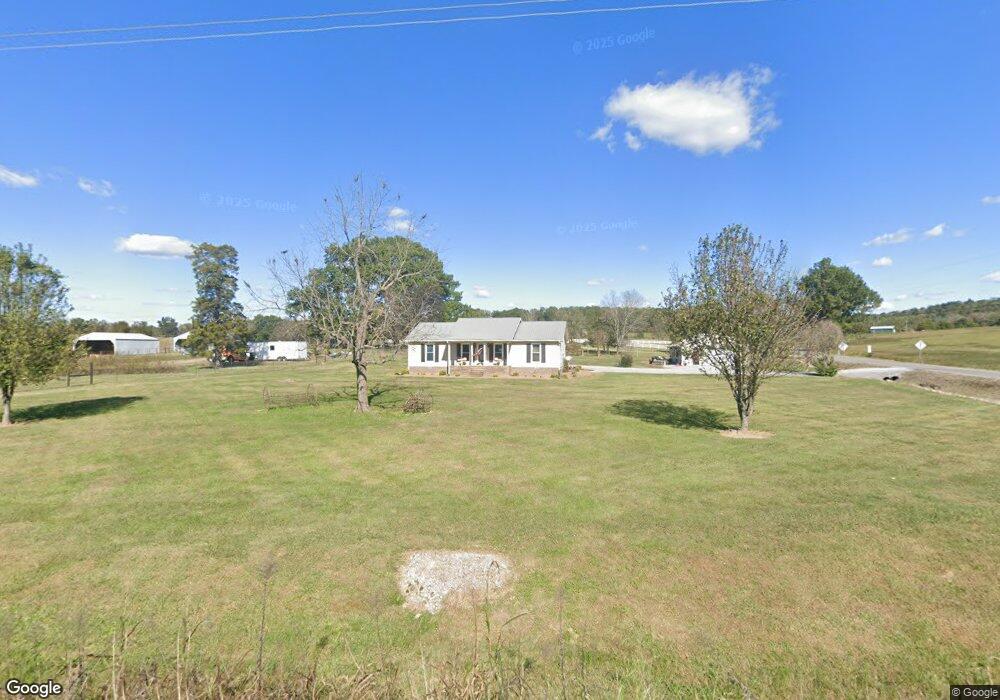
1198 New Hope Rd Shelbyville, TN 37160
Estimated Value: $302,510 - $594,000
--
Bed
2
Baths
2,028
Sq Ft
$207/Sq Ft
Est. Value
About This Home
This home is located at 1198 New Hope Rd, Shelbyville, TN 37160 and is currently estimated at $419,878, approximately $207 per square foot. 1198 New Hope Rd is a home located in Bedford County with nearby schools including Liberty Elementary School.
Ownership History
Date
Name
Owned For
Owner Type
Purchase Details
Closed on
May 24, 2024
Sold by
Mince Jason Edward
Bought by
Pope Joy Lynette
Current Estimated Value
Purchase Details
Closed on
Jul 15, 2005
Sold by
Jones Jerry
Bought by
Pope Joy Jones
Purchase Details
Closed on
Jul 1, 2005
Sold by
Jones Joy
Bought by
Jones Jerry
Purchase Details
Closed on
Jan 13, 2000
Bought by
Jones Jerry K and Jones Joy
Purchase Details
Closed on
Oct 14, 1998
Sold by
Pete Richards
Bought by
Jones Jerry K
Home Financials for this Owner
Home Financials are based on the most recent Mortgage that was taken out on this home.
Original Mortgage
$59,265
Interest Rate
6.76%
Purchase Details
Closed on
Mar 20, 1997
Sold by
Claxton Wanda B
Bought by
Pete Ii Richards
Purchase Details
Closed on
Oct 28, 1994
Bought by
Claxton Wanda B
Purchase Details
Closed on
Oct 24, 1994
Bought by
Claxton Wanda B
Purchase Details
Closed on
Aug 31, 1993
Bought by
Claxton Karl and Claxton Wanda B
Create a Home Valuation Report for This Property
The Home Valuation Report is an in-depth analysis detailing your home's value as well as a comparison with similar homes in the area
Home Values in the Area
Average Home Value in this Area
Purchase History
| Date | Buyer | Sale Price | Title Company |
|---|---|---|---|
| Pope Joy Lynette | -- | None Listed On Document | |
| Pope Joy Lynette | -- | None Listed On Document | |
| Pope Joy Jones | -- | -- | |
| Jones Jerry | -- | -- | |
| Jones Jerry K | -- | -- | |
| Jones Jerry K | $7,000 | -- | |
| Pete Ii Richards | $81,000 | -- | |
| Claxton Wanda B | $55,000 | -- | |
| Claxton Wanda B | $1,000 | -- | |
| Claxton Karl | -- | -- |
Source: Public Records
Mortgage History
| Date | Status | Borrower | Loan Amount |
|---|---|---|---|
| Previous Owner | Claxton Karl | $59,265 |
Source: Public Records
Tax History Compared to Growth
Tax History
| Year | Tax Paid | Tax Assessment Tax Assessment Total Assessment is a certain percentage of the fair market value that is determined by local assessors to be the total taxable value of land and additions on the property. | Land | Improvement |
|---|---|---|---|---|
| 2025 | $1,231 | $52,950 | $0 | $0 |
| 2024 | $1,231 | $52,950 | $7,075 | $45,875 |
| 2023 | $1,231 | $52,950 | $7,075 | $45,875 |
| 2022 | $1,231 | $52,950 | $7,075 | $45,875 |
| 2021 | $1,041 | $52,950 | $7,075 | $45,875 |
| 2020 | $1,031 | $52,950 | $7,075 | $45,875 |
| 2019 | $1,031 | $38,750 | $7,075 | $31,675 |
| 2018 | $992 | $38,750 | $7,075 | $31,675 |
| 2017 | $992 | $38,750 | $7,075 | $31,675 |
| 2016 | $977 | $38,750 | $7,075 | $31,675 |
| 2015 | $977 | $38,750 | $7,075 | $31,675 |
| 2014 | $819 | $36,092 | $0 | $0 |
Source: Public Records
Map
Nearby Homes
- 176 Corder Ln
- 0 New Center Church Rd
- 248 Old Flat Creek Rd
- 506 New Center Church Rd
- 455 Himesville Rd
- 495 Himesville Rd
- 209 Gladys Dr
- 119 Crestland Cir
- 0 Overlook Ln Unit RTC2889952
- 0 Overlook Ln Unit 1513245
- 0 Overlook Ln Unit RTC3015273
- 0 Himesville Rd
- 231 Riverbend Country Club Rd
- 0 Highway 130 E
- 315 Woodland Dr
- 1519 Highway 130 E
- 201 Sulphur Springs Rd
- 339 Riverbend Country Club Rd
- 128 Riverlake Rd
- 900 New Herman Rd
- 1196 New Hope Rd
- 1190 New Hope Rd
- 1953 Highway 82 S
- 2010 Highway 82 S
- 1944 Highway 82 S
- 1941 Highway 82 S
- 1941 Tennessee 82
- 2018 Highway 82 S
- 1131 New Hope Rd
- 2020 Highway 82 S
- 2019 Highway 82 S
- 1125 New Hope Rd
- 2025 Highway 82 S
- 0 Mill Rd
- 1130 New Hope Rd
- 1127 New Hope Rd
- 245 Mill Rd
- 1931 Highway 82 S
- 2028 Tennessee 82
- 2028 Highway 82 S