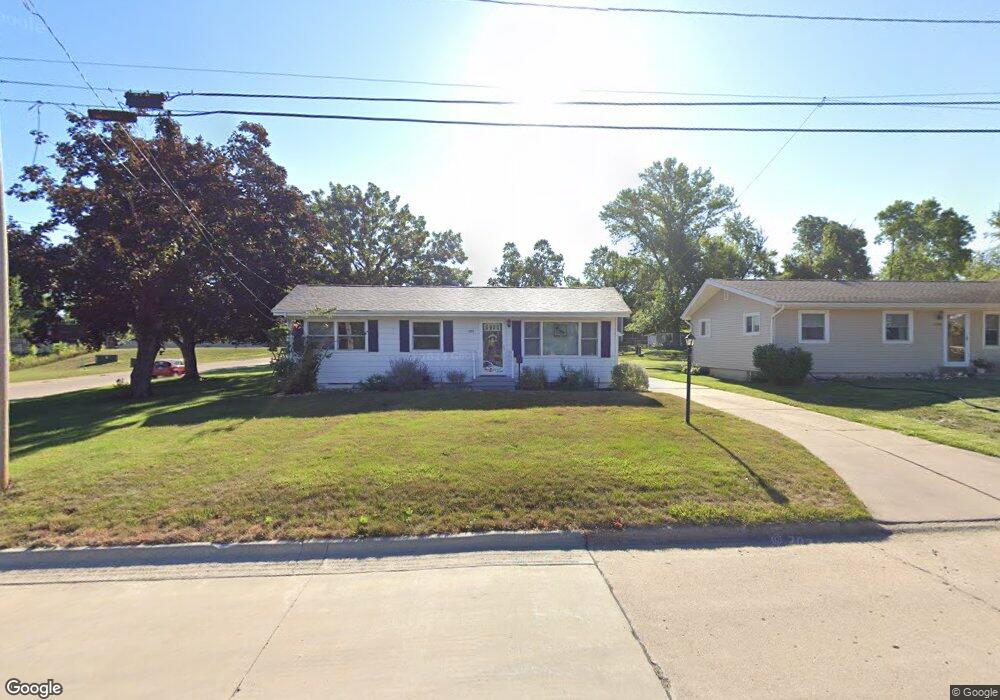
1199 4th St Marion, IA 52302
Estimated Value: $169,000 - $185,751
3
Beds
2
Baths
1,104
Sq Ft
$161/Sq Ft
Est. Value
About This Home
This home is located at 1199 4th St, Marion, IA 52302 and is currently estimated at $177,938, approximately $161 per square foot. 1199 4th St is a home located in Linn County with nearby schools including Longfellow Elementary, Francis Marion Intermediate School, and Vernon Middle School.
Ownership History
Date
Name
Owned For
Owner Type
Purchase Details
Closed on
Mar 7, 2018
Sold by
Sueppel Robert J and Sueppel Laurien J
Bought by
Kelly Patricia G and Kelly Terry M
Current Estimated Value
Home Financials for this Owner
Home Financials are based on the most recent Mortgage that was taken out on this home.
Original Mortgage
$95,200
Outstanding Balance
$81,463
Interest Rate
4.32%
Mortgage Type
New Conventional
Estimated Equity
$96,475
Create a Home Valuation Report for This Property
The Home Valuation Report is an in-depth analysis detailing your home's value as well as a comparison with similar homes in the area
Home Values in the Area
Average Home Value in this Area
Purchase History
| Date | Buyer | Sale Price | Title Company |
|---|---|---|---|
| Kelly Patricia G | $119,125 | None Available |
Source: Public Records
Mortgage History
| Date | Status | Borrower | Loan Amount |
|---|---|---|---|
| Open | Kelly Patricia G | $95,200 |
Source: Public Records
Tax History
| Year | Tax Paid | Tax Assessment Tax Assessment Total Assessment is a certain percentage of the fair market value that is determined by local assessors to be the total taxable value of land and additions on the property. | Land | Improvement |
|---|---|---|---|---|
| 2025 | $2,444 | $190,700 | $16,500 | $174,200 |
| 2024 | $3,030 | $147,700 | $16,500 | $131,200 |
| 2023 | $3,030 | $147,700 | $16,500 | $131,200 |
| 2022 | $2,924 | $145,000 | $16,500 | $128,500 |
| 2021 | $2,676 | $145,000 | $16,500 | $128,500 |
| 2020 | $2,676 | $127,000 | $16,500 | $110,500 |
| 2019 | $2,574 | $122,700 | $22,300 | $100,400 |
Source: Public Records
Map
Nearby Homes
Your Personal Tour Guide
Ask me questions while you tour the home.