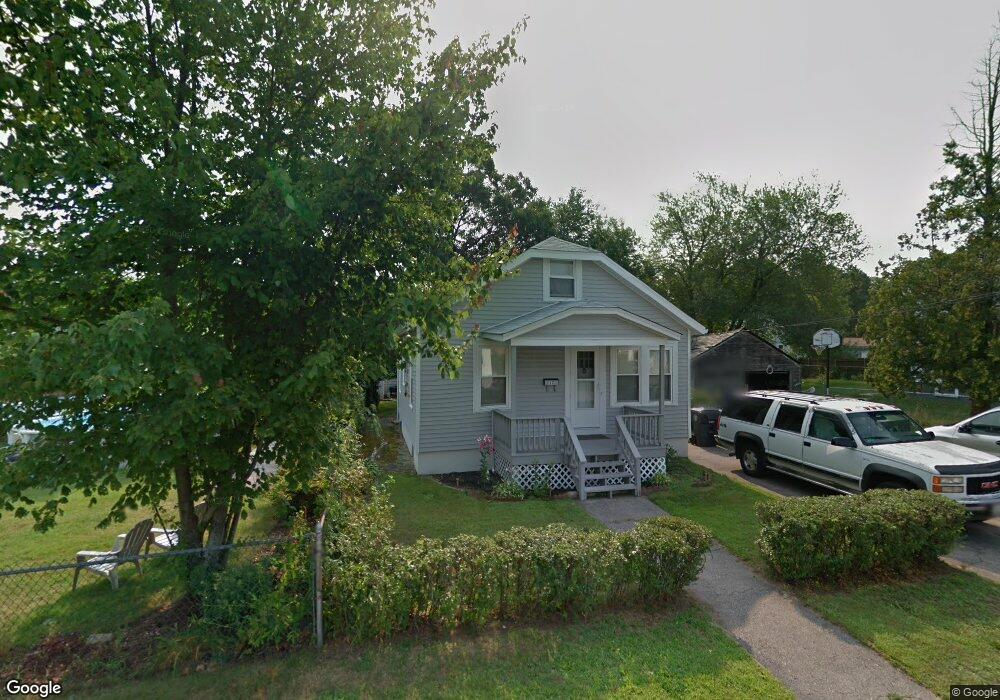
12 Aborn Ave Warwick, RI 02888
Palace Garden NeighborhoodEstimated Value: $295,000 - $364,000
2
Beds
1
Bath
768
Sq Ft
$423/Sq Ft
Est. Value
About This Home
This home is located at 12 Aborn Ave, Warwick, RI 02888 and is currently estimated at $325,236, approximately $423 per square foot. 12 Aborn Ave is a home located in Kent County with nearby schools including Saint Paul School and St. Peter School.
Ownership History
Date
Name
Owned For
Owner Type
Purchase Details
Closed on
Jun 11, 2020
Sold by
Anthony J Delgiudice Ret and Delgiudice
Bought by
Delgiudice Melissa M and Delgiudice Mason M
Current Estimated Value
Purchase Details
Closed on
Aug 18, 2017
Sold by
Delgiudice Anthony J
Bought by
Anthony J Delgiudice R J and Anthony Delgiudice
Create a Home Valuation Report for This Property
The Home Valuation Report is an in-depth analysis detailing your home's value as well as a comparison with similar homes in the area
Home Values in the Area
Average Home Value in this Area
Purchase History
| Date | Buyer | Sale Price | Title Company |
|---|---|---|---|
| Delgiudice Melissa M | -- | None Available | |
| Anthony J Delgiudice R J | -- | -- |
Source: Public Records
Tax History
| Year | Tax Paid | Tax Assessment Tax Assessment Total Assessment is a certain percentage of the fair market value that is determined by local assessors to be the total taxable value of land and additions on the property. | Land | Improvement |
|---|---|---|---|---|
| 2025 | $3,459 | $272,400 | $107,900 | $164,500 |
| 2024 | $3,361 | $232,300 | $90,200 | $142,100 |
| 2023 | $3,296 | $232,300 | $90,200 | $142,100 |
| 2022 | $3,085 | $164,700 | $58,100 | $106,600 |
| 2021 | $3,085 | $164,700 | $58,100 | $106,600 |
| 2020 | $3,085 | $164,700 | $58,100 | $106,600 |
| 2019 | $3,085 | $164,700 | $58,100 | $106,600 |
| 2018 | $2,523 | $121,300 | $55,900 | $65,400 |
| 2017 | $2,455 | $121,300 | $55,900 | $65,400 |
| 2016 | $2,455 | $121,300 | $55,900 | $65,400 |
| 2015 | $2,328 | $112,200 | $49,400 | $62,800 |
| 2014 | $2,251 | $112,200 | $49,400 | $62,800 |
| 2013 | $2,220 | $112,200 | $49,400 | $62,800 |
Source: Public Records
Map
Nearby Homes
- 27 Vickery St
- 210 Irving Rd
- 115 Irving Rd
- 94 Holmes Rd
- 200 Post Rd Unit 419
- 25 Newfield Ave
- 29 Malvern Ave
- 56 Errol St
- 127 Sherwood Ave
- 111 Sherwood Ave
- 171 Sherwood Ave
- 136 Sherwood Ave
- 120 Sherwood Ave
- 0 Remington St
- 27 Cliffdale Ave
- 10 Sylvan Ave
- 28 Manchester St
- 65 Perkins Ave
- 42 Netherlands Ave
- 73 Moorland Ave
Your Personal Tour Guide
Ask me questions while you tour the home.