12 Albin St Concord, NH 03301
North End NeighborhoodEstimated Value: $377,534 - $411,000
2
Beds
1
Bath
1,176
Sq Ft
$339/Sq Ft
Est. Value
About This Home
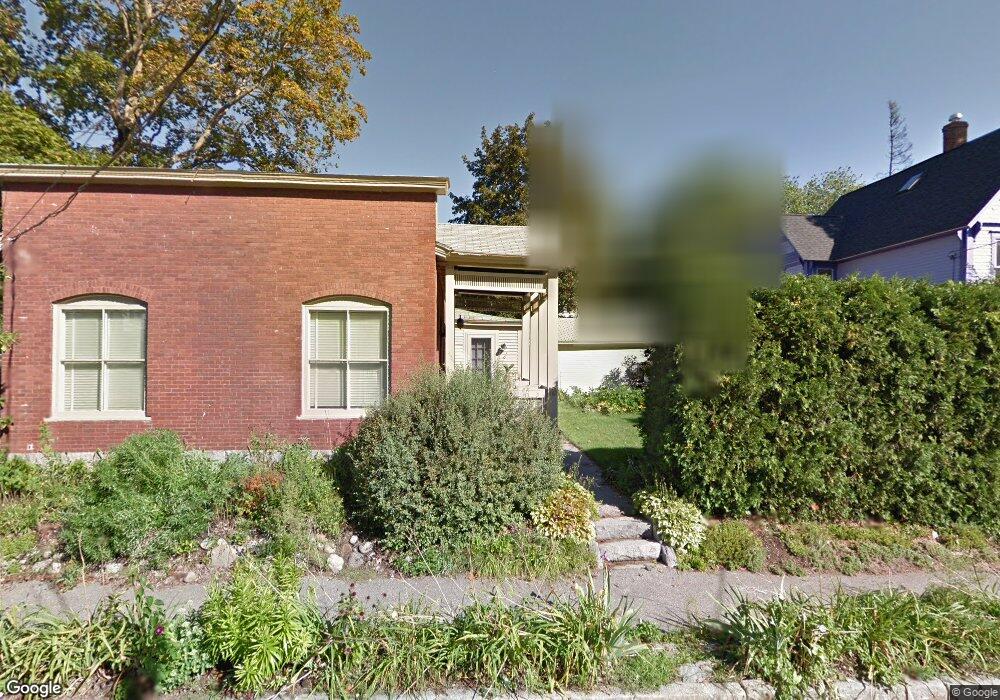
This home is located at 12 Albin St, Concord, NH 03301 and is currently estimated at $398,134, approximately $338 per square foot. 12 Albin St is a home located in Merrimack County with nearby schools including Christa McAuliffe School, Rundlett Middle School, and Concord High School.
Ownership History
Date
Name
Owned For
Owner Type
Purchase Details
Closed on
Dec 7, 2020
Sold by
Rymes Thomas J
Bought by
Cole-Rymes Bethany L and Rymes Thomas J
Current Estimated Value
Purchase Details
Closed on
May 29, 2007
Sold by
Higgins-Banzhoff Barbara
Bought by
Rymes Thomas J
Home Financials for this Owner
Home Financials are based on the most recent Mortgage that was taken out on this home.
Original Mortgage
$105,000
Interest Rate
6.27%
Mortgage Type
Purchase Money Mortgage
Purchase Details
Closed on
Sep 29, 1997
Sold by
Finney Matthew O and Finney Joanne B
Bought by
Higgins-Nelson Barbara
Home Financials for this Owner
Home Financials are based on the most recent Mortgage that was taken out on this home.
Original Mortgage
$91,053
Interest Rate
7.47%
Mortgage Type
Purchase Money Mortgage
Create a Home Valuation Report for This Property
The Home Valuation Report is an in-depth analysis detailing your home's value as well as a comparison with similar homes in the area
Home Values in the Area
Average Home Value in this Area
Purchase History
| Date | Buyer | Sale Price | Title Company |
|---|---|---|---|
| Cole-Rymes Bethany L | -- | None Available | |
| Rymes Thomas J | $194,900 | -- | |
| Higgins-Nelson Barbara | $91,700 | -- |
Source: Public Records
Mortgage History
| Date | Status | Borrower | Loan Amount |
|---|---|---|---|
| Previous Owner | Higgins-Nelson Barbara | $105,000 | |
| Previous Owner | Higgins-Nelson Barbara | $91,053 |
Source: Public Records
Tax History Compared to Growth
Tax History
| Year | Tax Paid | Tax Assessment Tax Assessment Total Assessment is a certain percentage of the fair market value that is determined by local assessors to be the total taxable value of land and additions on the property. | Land | Improvement |
|---|---|---|---|---|
| 2024 | $6,416 | $231,700 | $99,100 | $132,600 |
| 2023 | $6,223 | $231,700 | $99,100 | $132,600 |
| 2022 | $5,999 | $231,700 | $99,100 | $132,600 |
| 2021 | $5,820 | $231,700 | $99,100 | $132,600 |
| 2020 | $5,440 | $203,300 | $79,300 | $124,000 |
| 2019 | $5,209 | $187,500 | $75,000 | $112,500 |
| 2018 | $4,942 | $175,300 | $70,600 | $104,700 |
| 2017 | $4,555 | $161,300 | $68,400 | $92,900 |
| 2016 | $4,330 | $156,500 | $68,400 | $88,100 |
| 2015 | $3,951 | $144,500 | $63,400 | $81,100 |
| 2014 | $3,874 | $144,500 | $63,400 | $81,100 |
| 2013 | $3,643 | $142,400 | $63,400 | $79,000 |
| 2012 | $3,409 | $139,900 | $63,400 | $76,500 |
Source: Public Records
Map
Nearby Homes