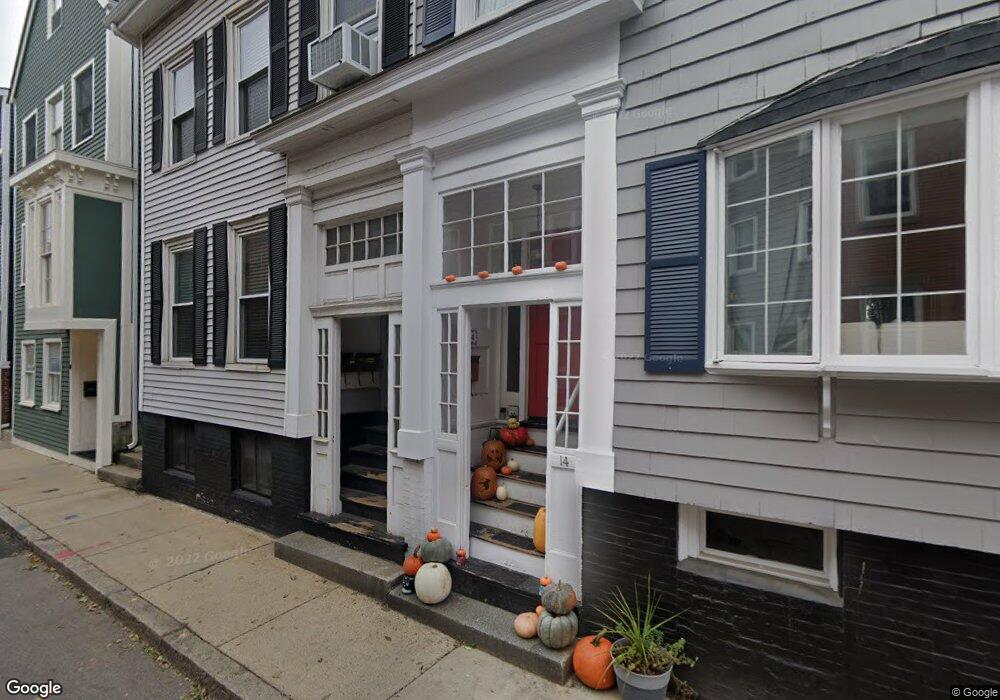
12 Allston St Charlestown, MA 02129
Thompson Square-Bunker Hill NeighborhoodEstimated Value: $992,000 - $1,384,699
3
Beds
3
Baths
1,612
Sq Ft
$751/Sq Ft
Est. Value
About This Home
This home is located at 12 Allston St, Charlestown, MA 02129 and is currently estimated at $1,210,425, approximately $750 per square foot. 12 Allston St is a home located in Suffolk County with nearby schools including Prospect Hill Academy Upper Elementary Campus.
Ownership History
Date
Name
Owned For
Owner Type
Purchase Details
Closed on
Oct 30, 2014
Sold by
Keating Kristin
Bought by
Twelve Allston Street
Current Estimated Value
Purchase Details
Closed on
Jul 1, 2004
Sold by
Robison David W and Robison Jennifer
Bought by
Keating Kristin E
Purchase Details
Closed on
Aug 24, 2000
Sold by
Macdougal William P and Macdougal Joan R
Bought by
Robison David W and Murphy Jennifer E
Create a Home Valuation Report for This Property
The Home Valuation Report is an in-depth analysis detailing your home's value as well as a comparison with similar homes in the area
Home Values in the Area
Average Home Value in this Area
Purchase History
| Date | Buyer | Sale Price | Title Company |
|---|---|---|---|
| Twelve Allston Street | -- | -- | |
| Keating Kristin E | $565,000 | -- | |
| Robison David W | $325,000 | -- |
Source: Public Records
Mortgage History
| Date | Status | Borrower | Loan Amount |
|---|---|---|---|
| Previous Owner | Robison David W | $470,000 | |
| Previous Owner | Robison David W | $470,000 |
Source: Public Records
Tax History Compared to Growth
Tax History
| Year | Tax Paid | Tax Assessment Tax Assessment Total Assessment is a certain percentage of the fair market value that is determined by local assessors to be the total taxable value of land and additions on the property. | Land | Improvement |
|---|---|---|---|---|
| 2025 | $11,691 | $1,009,600 | $318,700 | $690,900 |
| 2024 | $10,221 | $937,700 | $337,600 | $600,100 |
| 2023 | $9,327 | $868,400 | $312,700 | $555,700 |
| 2022 | $8,994 | $826,700 | $297,700 | $529,000 |
| 2021 | $8,400 | $787,300 | $283,500 | $503,800 |
| 2020 | $7,843 | $742,700 | $286,200 | $456,500 |
| 2019 | $7,115 | $675,000 | $221,000 | $454,000 |
| 2018 | $6,611 | $630,800 | $221,000 | $409,800 |
| 2017 | $6,680 | $630,800 | $221,000 | $409,800 |
| 2016 | $5,870 | $533,600 | $221,000 | $312,600 |
| 2015 | $5,475 | $452,100 | $190,700 | $261,400 |
| 2014 | $5,070 | $403,000 | $190,700 | $212,300 |
Source: Public Records
Map
Nearby Homes
- 255 Bunker Hill St Unit 2
- 247 Bunker Hill St Unit A
- 270 Bunker Hill St Unit 4
- 9 Russell St Unit 2
- 9 Russell St Unit 1
- 15 Russell St
- 207 Bunker Hill St Unit 2
- 254-256 Medford St Unit 2
- 64 Walker St Unit 66
- 56 Belmont St Unit 1
- 18R Polk St
- 172 Bunker Hill St Unit 1
- 24 N Mead St
- 29 Eden St Unit 3
- 40 Mead St Unit 3
- 364 Bunker Hill St Unit 1
- 56 High St Unit 3
- 46 High St
- 40 Chappie St Unit 1
- 106 Bunker Hill St Unit 2
- 12 Allston St Unit 2
- 12 Allston St Unit 1
- 14 Allston St
- 16 Allston St
- 10 Allston St Unit 3
- 10 Allston St Unit 2
- 10 Allston St Unit 1
- 13 Cook St
- 11 Allston St Unit 2
- 11 Allston St Unit 3
- 11 Allston St
- 9 Cook St Unit 2
- 9 Cook St Unit 1
- 13 Allston St
- 8 Allston St Unit 3
- 8 Allston St Unit 2
- 8 Allston St Unit 1
- 9 Allston St Unit 3
- 9 Allston St Unit 2
- 9 Allston St Unit 1