12 Andrea Rd Pocasset, MA 02559
Pocasset NeighborhoodEstimated Value: $605,000 - $814,000
3
Beds
1
Bath
1,196
Sq Ft
$578/Sq Ft
Est. Value
About This Home
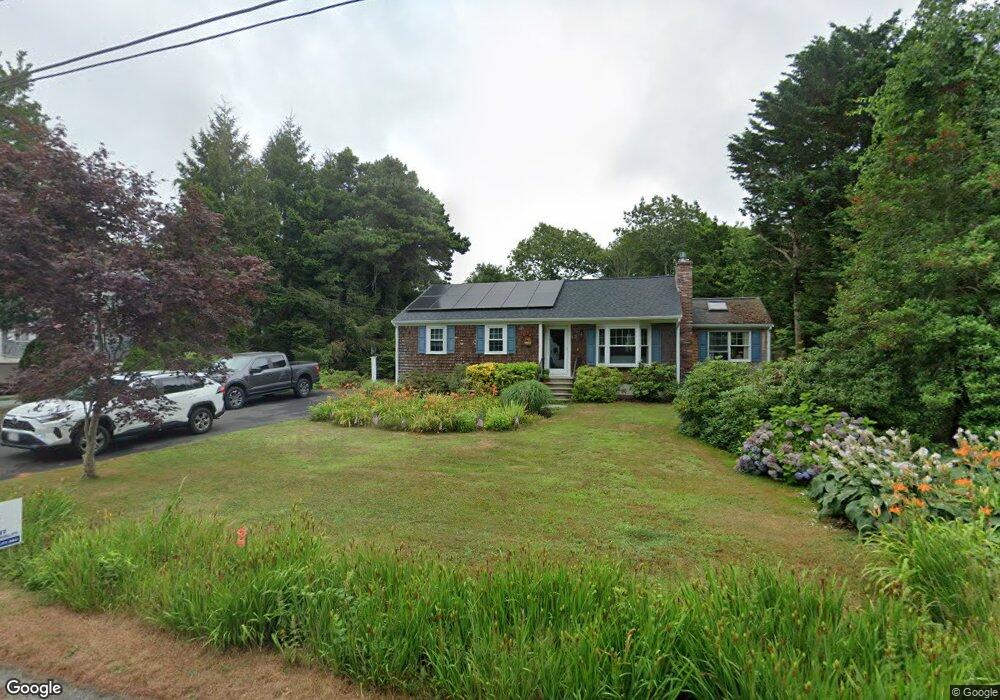
This home is located at 12 Andrea Rd, Pocasset, MA 02559 and is currently estimated at $691,455, approximately $578 per square foot. 12 Andrea Rd is a home located in Barnstable County with nearby schools including Bourne High School and Cadence Academy Preschool - Bourne.
Ownership History
Date
Name
Owned For
Owner Type
Purchase Details
Closed on
Oct 3, 2007
Sold by
Tracy George M and Burnell Virginia C
Bought by
Rinella Andrea and Donoghue Paul F
Current Estimated Value
Home Financials for this Owner
Home Financials are based on the most recent Mortgage that was taken out on this home.
Original Mortgage
$240,000
Outstanding Balance
$151,411
Interest Rate
6.59%
Mortgage Type
Purchase Money Mortgage
Estimated Equity
$540,044
Create a Home Valuation Report for This Property
The Home Valuation Report is an in-depth analysis detailing your home's value as well as a comparison with similar homes in the area
Home Values in the Area
Average Home Value in this Area
Purchase History
| Date | Buyer | Sale Price | Title Company |
|---|---|---|---|
| Rinella Andrea | $300,000 | -- | |
| Rinella Andrea | $300,000 | -- |
Source: Public Records
Mortgage History
| Date | Status | Borrower | Loan Amount |
|---|---|---|---|
| Open | Rinella Andrea | $240,000 | |
| Closed | Rinella Andrea | $240,000 |
Source: Public Records
Tax History Compared to Growth
Tax History
| Year | Tax Paid | Tax Assessment Tax Assessment Total Assessment is a certain percentage of the fair market value that is determined by local assessors to be the total taxable value of land and additions on the property. | Land | Improvement |
|---|---|---|---|---|
| 2025 | $4,388 | $561,800 | $340,700 | $221,100 |
| 2024 | $4,292 | $535,100 | $324,500 | $210,600 |
| 2023 | $3,962 | $449,700 | $263,200 | $186,500 |
| 2022 | $3,844 | $381,000 | $232,900 | $148,100 |
| 2021 | $3,755 | $348,700 | $212,000 | $136,700 |
| 2020 | $3,654 | $340,200 | $210,000 | $130,200 |
| 2019 | $3,500 | $333,000 | $210,000 | $123,000 |
| 2018 | $3,280 | $311,200 | $200,000 | $111,200 |
| 2017 | $3,174 | $308,200 | $198,100 | $110,100 |
| 2016 | $2,740 | $269,700 | $174,100 | $95,600 |
| 2015 | $2,716 | $269,700 | $174,100 | $95,600 |
Source: Public Records
Map
Nearby Homes
- 171 Bellavista Dr
- 34 Kenwood Rd
- 45 Kenwood Rd
- 70 Wings Neck Rd
- 24 Richmond Rd
- 254 Barlows Landing Rd
- 14 Navajo Rd
- 22 Nairn Rd
- 940 County Rd
- 89 Harbor Dr
- 709 County Rd
- 174 Barlows Landing Rd
- 39 Bennets Neck Dr
- 48 Red Brook Harbor Rd
- 15 1st St
- 7 4th Ave
- 3 Red Brook Pond Dr
- 940 County Rd
- 1094 County Rd
- 515 County Rd