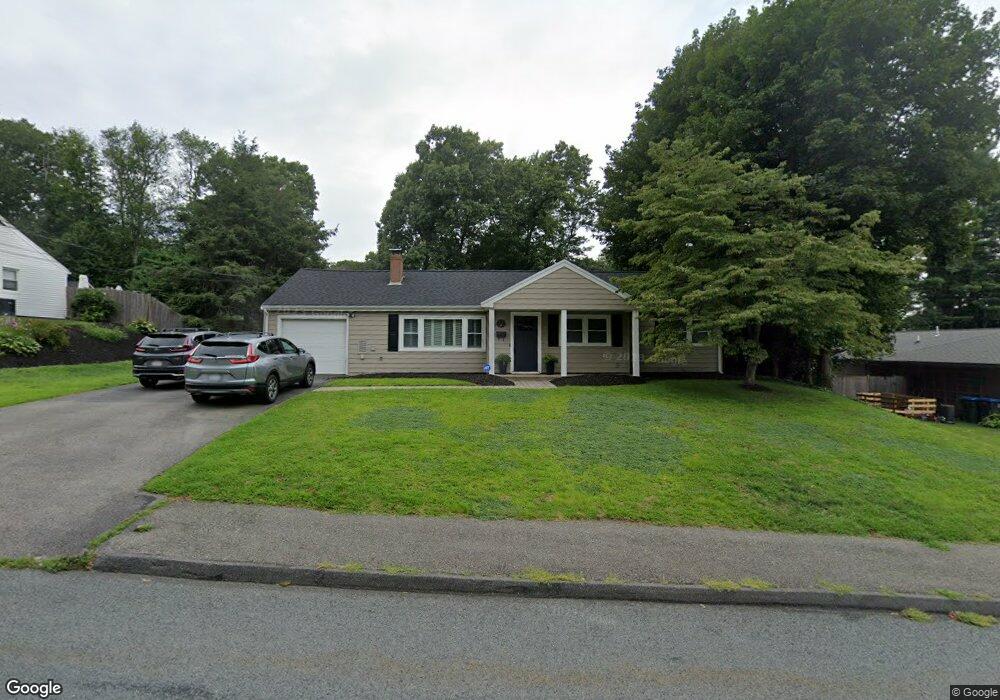
12 Appleton Rd Natick, MA 01760
Estimated Value: $718,000 - $1,043,000
3
Beds
1
Bath
1,018
Sq Ft
$813/Sq Ft
Est. Value
About This Home
This home is located at 12 Appleton Rd, Natick, MA 01760 and is currently estimated at $828,077, approximately $813 per square foot. 12 Appleton Rd is a home located in Middlesex County with nearby schools including Natick High School, Bennett-Hemenway (Ben-Hem) Elementary School, and Wilson Middle School.
Ownership History
Date
Name
Owned For
Owner Type
Purchase Details
Closed on
Nov 3, 1999
Sold by
Sheer Nancy A and Noel Kimberly
Bought by
Sheehy Kimberly
Current Estimated Value
Purchase Details
Closed on
Sep 28, 1992
Sold by
Hewitt Lauren M
Bought by
Sheer Nancy A and Noel Kimberly A
Purchase Details
Closed on
Jul 6, 1989
Sold by
Hewitt Donald E
Bought by
Hewitt Lauren M L
Create a Home Valuation Report for This Property
The Home Valuation Report is an in-depth analysis detailing your home's value as well as a comparison with similar homes in the area
Home Values in the Area
Average Home Value in this Area
Purchase History
| Date | Buyer | Sale Price | Title Company |
|---|---|---|---|
| Sheehy Kimberly | $35,000 | -- | |
| Sheer Nancy A | $146,750 | -- | |
| Hewitt Lauren M L | $22,690 | -- |
Source: Public Records
Mortgage History
| Date | Status | Borrower | Loan Amount |
|---|---|---|---|
| Open | Hewitt Lauren M L | $280,000 | |
| Closed | Hewitt Lauren M L | $260,000 | |
| Closed | Hewitt Lauren M L | $60,000 |
Source: Public Records
Tax History
| Year | Tax Paid | Tax Assessment Tax Assessment Total Assessment is a certain percentage of the fair market value that is determined by local assessors to be the total taxable value of land and additions on the property. | Land | Improvement |
|---|---|---|---|---|
| 2025 | $7,837 | $655,300 | $461,300 | $194,000 |
| 2024 | $7,621 | $621,600 | $435,700 | $185,900 |
| 2023 | $7,389 | $584,600 | $409,000 | $175,600 |
| 2022 | $7,173 | $537,700 | $372,300 | $165,400 |
| 2021 | $4,926 | $507,200 | $351,900 | $155,300 |
| 2020 | $6,695 | $491,900 | $336,600 | $155,300 |
| 2019 | $5,852 | $460,400 | $336,600 | $123,800 |
| 2018 | $5,220 | $400,000 | $306,000 | $94,000 |
| 2017 | $4,681 | $364,800 | $272,500 | $92,300 |
| 2016 | $4,736 | $349,000 | $257,500 | $91,500 |
| 2015 | $4,718 | $341,400 | $257,500 | $83,900 |
Source: Public Records
Map
Nearby Homes
Your Personal Tour Guide
Ask me questions while you tour the home.