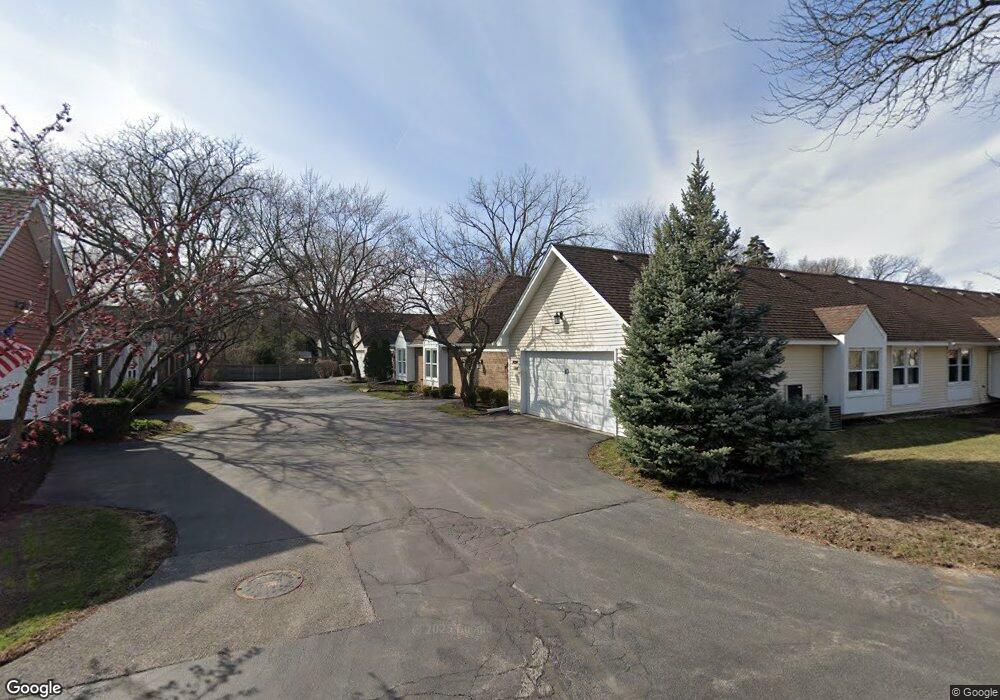
12 Attleboro on Auburn Rolling Meadows, IL 60008
Creekside NeighborhoodEstimated Value: $355,000 - $396,000
4
Beds
2
Baths
1,568
Sq Ft
$237/Sq Ft
Est. Value
About This Home
This home is located at 12 Attleboro on Auburn, Rolling Meadows, IL 60008 and is currently estimated at $371,395, approximately $236 per square foot. 12 Attleboro on Auburn is a home located in Cook County with nearby schools including Central Road Elementary School, Galatia Junior High School, and William Fremd High School.
Ownership History
Date
Name
Owned For
Owner Type
Purchase Details
Closed on
Dec 10, 2018
Sold by
Ruetschlin Harry M
Bought by
Ruetschlin Carrie J and Ruetschlin Harry M
Current Estimated Value
Purchase Details
Closed on
Nov 9, 2018
Sold by
Ruetschlin Harry M
Bought by
Ruetschlin Harry M
Purchase Details
Closed on
Jan 30, 2014
Sold by
Martin Gabriel E and Martin Gabriel E
Bought by
Irrevocable Ruetschlin Harry M and Gabriele M Martin Irrevocable Trust
Purchase Details
Closed on
Jul 11, 1997
Sold by
Blomquist Ernest R and Evans Ralph R
Bought by
Martin Gabriel E
Purchase Details
Closed on
Jun 24, 1994
Sold by
Parkway Bank & Trust Company
Bought by
Evans Ralph R
Home Financials for this Owner
Home Financials are based on the most recent Mortgage that was taken out on this home.
Original Mortgage
$198,000
Interest Rate
8.44%
Create a Home Valuation Report for This Property
The Home Valuation Report is an in-depth analysis detailing your home's value as well as a comparison with similar homes in the area
Home Values in the Area
Average Home Value in this Area
Purchase History
| Date | Buyer | Sale Price | Title Company |
|---|---|---|---|
| Ruetschlin Carrie J | -- | Attorney | |
| Ruetschlin Harry M | -- | Attorney | |
| Irrevocable Ruetschlin Harry M | -- | None Available | |
| Martin Gabriel E | $195,000 | -- | |
| Evans Ralph R | $198,000 | -- |
Source: Public Records
Mortgage History
| Date | Status | Borrower | Loan Amount |
|---|---|---|---|
| Previous Owner | Evans Ralph R | $198,000 | |
| Closed | Evans Ralph R | $198,000 |
Source: Public Records
Tax History Compared to Growth
Tax History
| Year | Tax Paid | Tax Assessment Tax Assessment Total Assessment is a certain percentage of the fair market value that is determined by local assessors to be the total taxable value of land and additions on the property. | Land | Improvement |
|---|---|---|---|---|
| 2024 | $7,577 | $24,000 | $5,000 | $19,000 |
| 2023 | $7,295 | $24,000 | $5,000 | $19,000 |
| 2022 | $7,295 | $24,000 | $5,000 | $19,000 |
| 2021 | $7,791 | $22,790 | $3,897 | $18,893 |
| 2020 | $7,667 | $22,790 | $3,897 | $18,893 |
| 2019 | $5,833 | $25,464 | $3,897 | $21,567 |
| 2018 | $3,522 | $21,872 | $3,464 | $18,408 |
| 2017 | $5,180 | $21,872 | $3,464 | $18,408 |
| 2016 | $3,988 | $21,872 | $3,464 | $18,408 |
| 2015 | $4,478 | $18,264 | $3,175 | $15,089 |
| 2014 | $5,831 | $18,264 | $3,175 | $15,089 |
| 2013 | $4,284 | $18,264 | $3,175 | $15,089 |
Source: Public Records
Map
Nearby Homes
- 208 Brookdale Ln
- 200 Edgewood Ln
- 2600 Brookwood Way Dr Unit 316
- 2600 Brookwood Way Dr Unit 305
- 2600 Brookwood Unit 314
- 2600 Brookwood Way Dr Unit 212
- 160 E Forest Ln
- 3805 Fairfax Ave
- 3355 Kirchoff Rd Unit 6A
- 3400 Wellington Ct Unit 306
- 3600 Owl Dr
- 3265 Kirchoff Rd Unit 223
- 2401 Rohlwing Rd
- 372 Longacres Ln
- 3125 Town Square Dr Unit 408
- 4101 Owl Dr
- 2041 Vermont St
- 4301 Euclid Ave
- 4209 Owl Dr
- 1620 Waxwing Ct
- 3 Holyoke on Auburn
- 10 Attleboro on Auburn
- 1 Holyoke on Auburn
- 7 Attleboro on Auburn
- 5 Attleboro on Auburn
- 4 Juniper Rd
- 4 Attleboro on Auburn
- 1 Old Saybrook on Auburn
- 3 Old Saybrook on Auburn
- 2 Attleboro on Auburn
- 3 Redbud Rd
- 14 Attleboro on Auburn
- 6 Juniper Rd
- 4 Old Saybrook on Auburn
- 1 Manomet on Auburn
- 3 Attleboro on Auburn
- 16 Attleboro on Auburn
- 2 Old Saybrook on Auburn
- 2 Juniper Rd
- 1 Attleboro on Auburn