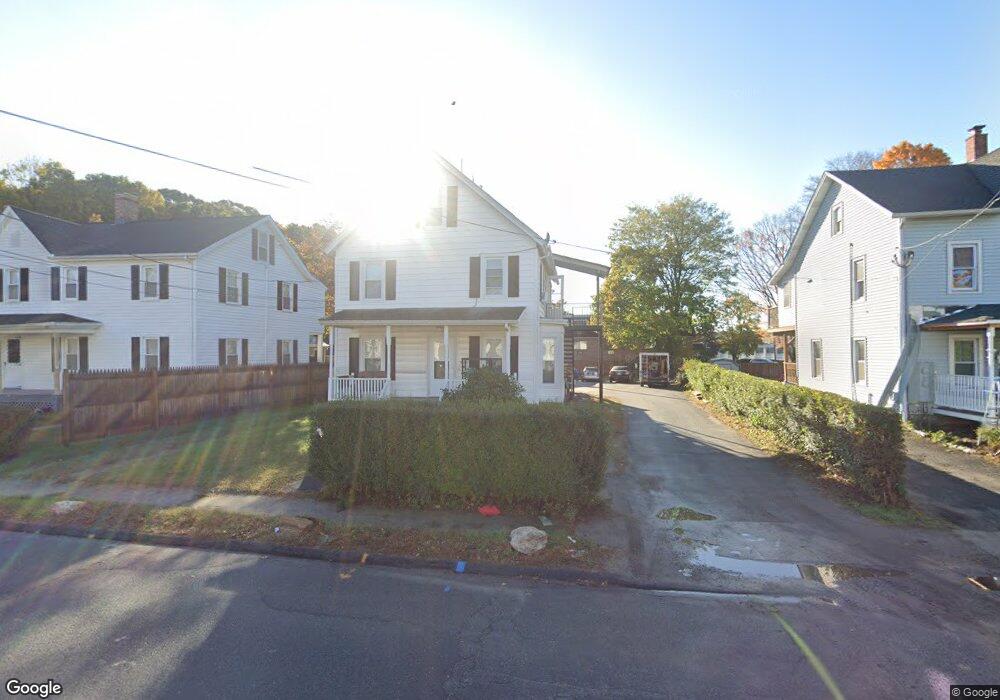
12 Austin St Unit 1 Danbury, CT 06810
Estimated Value: $483,023 - $644,000
2
Beds
1
Bath
1,000
Sq Ft
$553/Sq Ft
Est. Value
About This Home
This home is located at 12 Austin St Unit 1, Danbury, CT 06810 and is currently estimated at $552,506, approximately $552 per square foot. 12 Austin St Unit 1 is a home located in Fairfield County with nearby schools including Shelter Rock School, Rogers Park Middle School, and Danbury High School.
Ownership History
Date
Name
Owned For
Owner Type
Purchase Details
Closed on
Sep 20, 2017
Sold by
Gamby John R
Bought by
Cajamarca Wilson A and Cajamarca Nelson
Current Estimated Value
Home Financials for this Owner
Home Financials are based on the most recent Mortgage that was taken out on this home.
Original Mortgage
$319,113
Outstanding Balance
$270,662
Interest Rate
4.5%
Mortgage Type
FHA
Estimated Equity
$281,844
Purchase Details
Closed on
Oct 1, 2009
Sold by
Bank Of New York
Bought by
Gamby John R
Purchase Details
Closed on
Jan 22, 2009
Sold by
Alfaro Edwin and Edwin Alfaro A
Bought by
Bank Of New York
Purchase Details
Closed on
Apr 15, 2005
Sold by
Alfaro Juana
Bought by
Alfaro Edwin
Purchase Details
Closed on
Jul 21, 1999
Sold by
Dohan Nicholas and Dohan Pamela
Bought by
Alfaro Juana
Purchase Details
Closed on
Oct 28, 1987
Sold by
Mockovak Christine
Bought by
Dohan Pamela
Create a Home Valuation Report for This Property
The Home Valuation Report is an in-depth analysis detailing your home's value as well as a comparison with similar homes in the area
Home Values in the Area
Average Home Value in this Area
Purchase History
| Date | Buyer | Sale Price | Title Company |
|---|---|---|---|
| Cajamarca Wilson A | $325,000 | -- | |
| Gamby John R | -- | -- | |
| Bank Of New York | -- | -- | |
| Alfaro Edwin | $375,000 | -- | |
| Alfaro Juana | $134,000 | -- | |
| Dohan Pamela | $138,000 | -- |
Source: Public Records
Mortgage History
| Date | Status | Borrower | Loan Amount |
|---|---|---|---|
| Open | Dohan Pamela | $319,113 | |
| Previous Owner | Dohan Pamela | $154,000 |
Source: Public Records
Tax History Compared to Growth
Tax History
| Year | Tax Paid | Tax Assessment Tax Assessment Total Assessment is a certain percentage of the fair market value that is determined by local assessors to be the total taxable value of land and additions on the property. | Land | Improvement |
|---|---|---|---|---|
| 2025 | $6,632 | $265,370 | $69,020 | $196,350 |
| 2024 | $6,486 | $265,370 | $69,020 | $196,350 |
| 2023 | $6,191 | $265,370 | $69,020 | $196,350 |
| 2022 | $4,239 | $150,200 | $59,600 | $90,600 |
| 2021 | $4,146 | $150,200 | $59,600 | $90,600 |
| 2020 | $4,146 | $150,200 | $59,600 | $90,600 |
| 2019 | $4,146 | $150,200 | $59,600 | $90,600 |
| 2018 | $4,146 | $150,200 | $59,600 | $90,600 |
| 2017 | $3,393 | $117,200 | $56,800 | $60,400 |
| 2016 | $3,361 | $117,200 | $56,800 | $60,400 |
| 2015 | $3,312 | $117,200 | $56,800 | $60,400 |
| 2014 | $3,235 | $117,200 | $56,800 | $60,400 |
Source: Public Records
Map
Nearby Homes
- 51 Wildman St Unit 407
- 51 Wildman St Unit B401
- 51 Wildman St Unit A312
- 127 Triangle St
- 18 Meadow St
- 20 Meadow St
- 35 Briarwood Dr
- 8 Briarwood Dr
- 92 Woodcrest Ln
- 55 Cross St Unit B6
- 1 Beaver Brook Rd Unit 37
- 25 E Cross Trail Unit 25
- 22 Brentwood Cir Unit 22
- 416 Center Meadow Ln Unit 416
- 61 Brentwood Cir Unit 66
- 101 Brentwood Cir Unit 101
- 5 W Cross Trail Unit 5
- 25 Topstone Dr
- 10 Liberty St Unit 32
- 23 Westview Dr
- 12 Austin St
- 10 Austin St
- 14 Austin St
- 8 Austin St
- 16 Austin St
- 49 Wildman St
- 20 Austin St
- 19 Austin St Unit 21
- 13 Austin St
- 15 Austin St
- 9 Austin St
- 55 Wildman St Unit 505
- 55 Wildman St Unit 305
- 55 Wildman St Unit 207
- 55 Wildman St Unit 601
- 55 Wildman St Unit 308
- 55 Wildman St Unit 103
- 55 Wildman St Unit 201
- 55 Wildman St Unit 303
- 55 Wildman St Unit A210