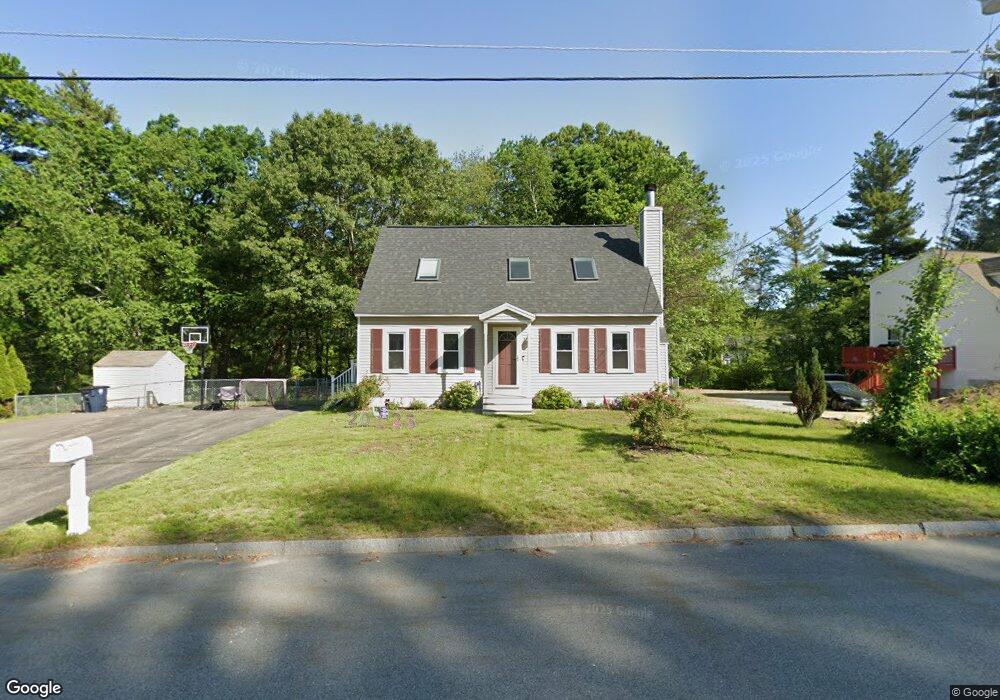
12 Beckmann Ln Nashua, NH 03062
Southwest Nashua NeighborhoodEstimated Value: $550,000 - $585,000
3
Beds
3
Baths
1,632
Sq Ft
$350/Sq Ft
Est. Value
About This Home
This home is located at 12 Beckmann Ln, Nashua, NH 03062 and is currently estimated at $571,333, approximately $350 per square foot. 12 Beckmann Ln is a home located in Hillsborough County with nearby schools including Bicentennial Elementary School, Fairgrounds Middle School, and Nashua High School South.
Ownership History
Date
Name
Owned For
Owner Type
Purchase Details
Closed on
Jul 8, 2024
Sold by
Mgk Ret and Keefe
Bought by
Mgk Ret and Keefe
Current Estimated Value
Home Financials for this Owner
Home Financials are based on the most recent Mortgage that was taken out on this home.
Original Mortgage
$100,000
Outstanding Balance
$99,387
Interest Rate
6.87%
Mortgage Type
Credit Line Revolving
Estimated Equity
$471,946
Purchase Details
Closed on
Mar 27, 2017
Sold by
Keefe Michelle G
Bought by
Mgk Ret and Keefe
Purchase Details
Closed on
Nov 14, 2007
Sold by
Goss Suzanne R
Bought by
Keefe Michelle G
Home Financials for this Owner
Home Financials are based on the most recent Mortgage that was taken out on this home.
Original Mortgage
$272,650
Interest Rate
6.41%
Mortgage Type
Purchase Money Mortgage
Purchase Details
Closed on
Sep 5, 2003
Sold by
Davis Keith D
Bought by
Goss Suzanne R
Create a Home Valuation Report for This Property
The Home Valuation Report is an in-depth analysis detailing your home's value as well as a comparison with similar homes in the area
Home Values in the Area
Average Home Value in this Area
Purchase History
| Date | Buyer | Sale Price | Title Company |
|---|---|---|---|
| Mgk Ret | -- | None Available | |
| Mgk Ret | -- | None Available | |
| Mgk Ret | -- | -- | |
| Keefe Michelle G | $287,000 | -- | |
| Goss Suzanne R | $255,000 | -- | |
| Mgk Ret | -- | -- | |
| Keefe Michelle G | $287,000 | -- | |
| Goss Suzanne R | $255,000 | -- |
Source: Public Records
Mortgage History
| Date | Status | Borrower | Loan Amount |
|---|---|---|---|
| Open | Mgk Ret | $100,000 | |
| Closed | Mgk Ret | $100,000 | |
| Previous Owner | Goss Suzanne R | $268,000 | |
| Previous Owner | Goss Suzanne R | $272,650 |
Source: Public Records
Tax History Compared to Growth
Tax History
| Year | Tax Paid | Tax Assessment Tax Assessment Total Assessment is a certain percentage of the fair market value that is determined by local assessors to be the total taxable value of land and additions on the property. | Land | Improvement |
|---|---|---|---|---|
| 2024 | $8,047 | $506,100 | $170,800 | $335,300 |
| 2023 | $7,677 | $421,100 | $136,600 | $284,500 |
| 2022 | $7,609 | $421,100 | $136,600 | $284,500 |
| 2021 | $6,794 | $292,600 | $100,200 | $192,400 |
| 2020 | $6,616 | $292,600 | $100,200 | $192,400 |
| 2019 | $6,367 | $292,600 | $100,200 | $192,400 |
| 2018 | $6,206 | $292,600 | $100,200 | $192,400 |
| 2017 | $5,702 | $221,100 | $86,300 | $134,800 |
| 2016 | $5,528 | $220,500 | $86,300 | $134,200 |
| 2015 | $5,409 | $220,500 | $86,300 | $134,200 |
| 2014 | $5,303 | $220,500 | $86,300 | $134,200 |
Source: Public Records
Map
Nearby Homes
- 33 Cannon Dr
- 5 Appaloosa Place
- 57 Wethersfield Rd
- 29 Dickens St
- 29 Greenwood Dr
- 23 Glen Dr
- 9 Byron Dr
- 125 Lille Rd
- 15 Westray Dr
- 5 Wilderness Dr
- 17 Herrick St
- 61 Spindlewick Dr
- 31 Tenby Dr
- 4 Henry David Dr Unit 203
- 285 E Dunstable Rd
- 15 Learned St Unit 123
- 6 Hayden St
- 10 Lamb Rd
- 63 Dexter St
- 36 Eastman St Unit 26