12 Beechnut Rd Dracut, MA 01826
Estimated Value: $908,000 - $1,041,000
About This Home
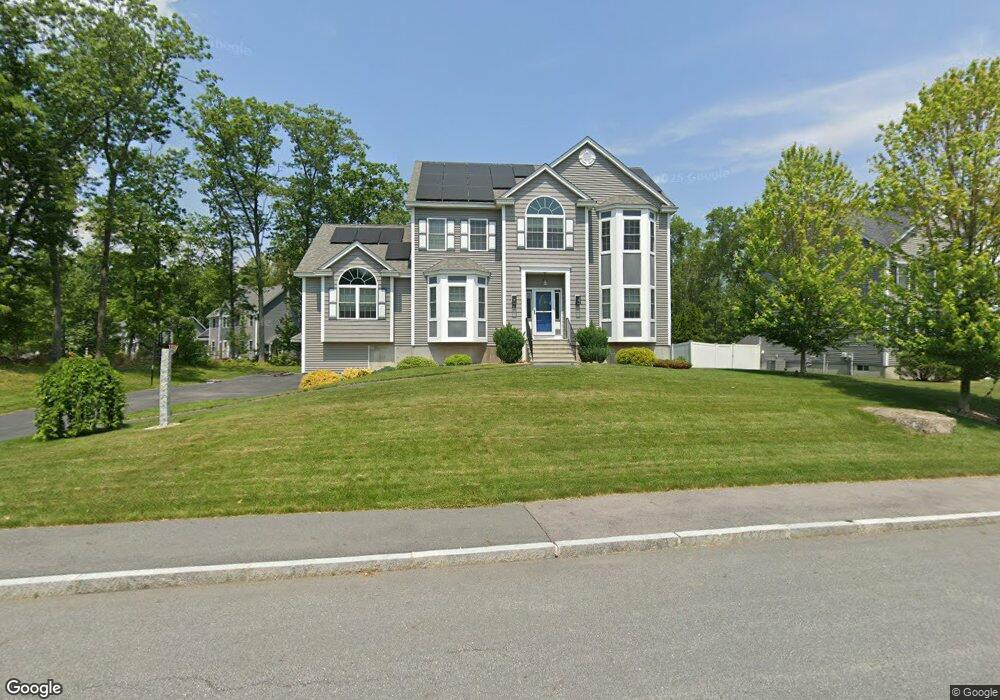
This home is located at 12 Beechnut Rd, Dracut, MA 01826 and is currently estimated at $970,519, approximately $352 per square foot. 12 Beechnut Rd is a home located in Middlesex County with nearby schools including Brookside Elementary School, Richardson Middle School, and Dracut Senior High School.
Ownership History
We collect this data history from publicly available records. To have your information removed, we recommend requesting removal directly through your county’s website.
Purchase Details
Home Financials for this Owner
Home Financials are based on the most recent Mortgage that was taken out on this home.Purchase Details
Home Financials for this Owner
Home Financials are based on the most recent Mortgage that was taken out on this home.Home Values in the Area
Average Home Value in this Area
Purchase History
We collect this data history from publicly available records. To have your information removed, we recommend requesting removal directly through your county’s website.
| Date | Buyer | Sale Price | Title Company |
|---|---|---|---|
| $910,000 | None Available | ||
| $515,600 | -- |
Mortgage History
We collect this data history from publicly available records. To have your information removed, we recommend requesting removal directly through your county’s website.
| Date | Status | Borrower | Loan Amount |
|---|---|---|---|
| Open | $610,000 | ||
| Previous Owner | $412,480 |
Tax History
We collect this data history from publicly available records. To have your information removed, we recommend requesting removal directly through your county’s website.
| Year | Tax Paid | Tax Assessment Tax Assessment Total Assessment is a certain percentage of the fair market value that is determined by local assessors to be the total taxable value of land and additions on the property. | Land | Improvement |
|---|---|---|---|---|
| 2025 | $8,244 | $814,600 | $222,600 | $592,000 |
| 2024 | $8,081 | $773,300 | $212,000 | $561,300 |
| 2023 | $7,637 | $659,500 | $184,300 | $475,200 |
| 2022 | $7,609 | $619,100 | $167,500 | $451,600 |
| 2021 | $7,404 | $569,100 | $152,300 | $416,800 |
| 2020 | $7,321 | $548,400 | $147,900 | $400,500 |
| 2019 | $7,311 | $531,700 | $140,800 | $390,900 |
| 2018 | $7,421 | $524,800 | $146,900 | $377,900 |
| 2017 | $3,373 | $524,800 | $146,900 | $377,900 |
| 2016 | $733 | $49,400 | $49,400 | $0 |
| 2015 | $738 | $49,400 | $49,400 | $0 |
| 2014 | $716 | $49,400 | $49,400 | $0 |
Map
- 145 Clement Rd
- 51 Richardson Ave
- 339 Passaconaway Dr
- 50 Corrine Dr
- 36 Fanning Ave
- 21 Payton St
- 80 Pine Valley Dr
- 10 Vandette Ave
- 1310 Mammoth Rd
- 119 Myron St
- 190 Wyndridge Cir
- 67 Charles St
- 25 Charles St
- 54 Long Dr
- 827 Nashua Rd
- 1222 Mammoth Rd
- 14 Dale Ave
- 79 Wyndridge Cir
- 105 Wyndridge Cir
- 20 Hillcrest Ave
Ask me questions while you tour the home.