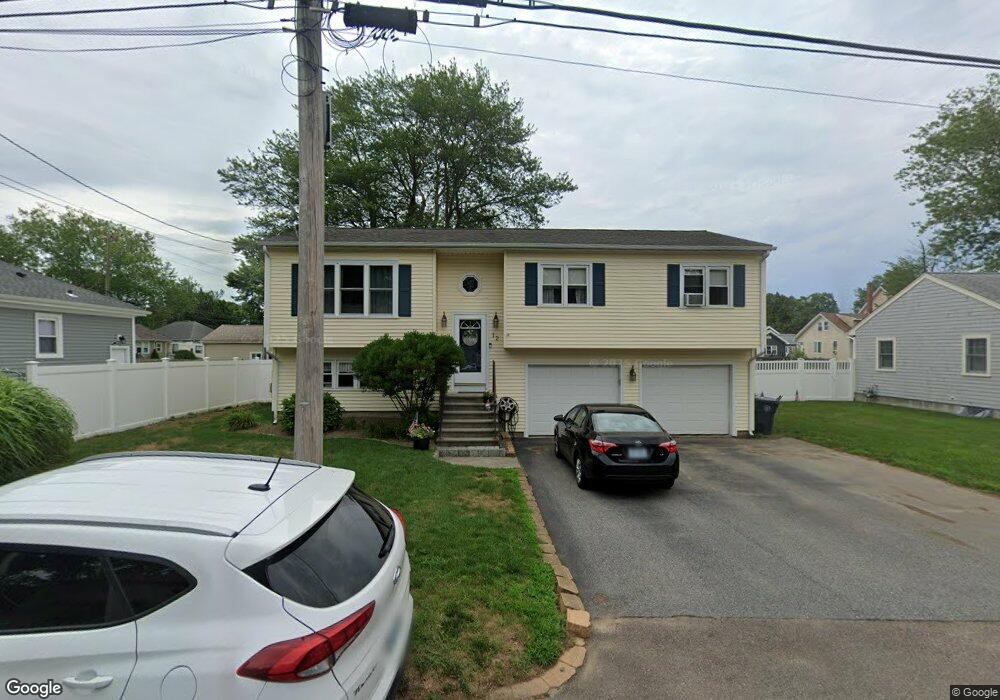
12 Belt St Warwick, RI 02889
Long Meadow NeighborhoodEstimated Value: $426,936 - $502,000
4
Beds
3
Baths
1,664
Sq Ft
$279/Sq Ft
Est. Value
About This Home
This home is located at 12 Belt St, Warwick, RI 02889 and is currently estimated at $463,734, approximately $278 per square foot. 12 Belt St is a home located in Kent County with nearby schools including Saint Kevin School and Bishop Hendricken High School.
Ownership History
Date
Name
Owned For
Owner Type
Purchase Details
Closed on
Aug 28, 2003
Sold by
Bates Warren G and Bates Theresa
Bought by
Scalzo Dennis A and Scalzo Kerri A
Current Estimated Value
Home Financials for this Owner
Home Financials are based on the most recent Mortgage that was taken out on this home.
Original Mortgage
$170,000
Interest Rate
5.69%
Mortgage Type
Purchase Money Mortgage
Purchase Details
Closed on
May 16, 2002
Sold by
Quaranta Angelo and Quaranta Danielle
Bought by
Bates Warren G and Bates Theresa
Home Financials for this Owner
Home Financials are based on the most recent Mortgage that was taken out on this home.
Original Mortgage
$127,900
Interest Rate
7.15%
Mortgage Type
Purchase Money Mortgage
Purchase Details
Closed on
Jun 30, 1998
Sold by
Chofay Tina M
Bought by
Quaranta Angelo and Quaranta Danielle
Purchase Details
Closed on
Nov 13, 1989
Sold by
Sionni Stephen F
Bought by
Day Ronald C
Create a Home Valuation Report for This Property
The Home Valuation Report is an in-depth analysis detailing your home's value as well as a comparison with similar homes in the area
Home Values in the Area
Average Home Value in this Area
Purchase History
| Date | Buyer | Sale Price | Title Company |
|---|---|---|---|
| Scalzo Dennis A | $250,000 | -- | |
| Bates Warren G | $160,000 | -- | |
| Quaranta Angelo | $116,000 | -- | |
| Day Ronald C | $138,500 | -- | |
| Day Ronald C | $138,500 | -- |
Source: Public Records
Mortgage History
| Date | Status | Borrower | Loan Amount |
|---|---|---|---|
| Open | Day Ronald C | $179,029 | |
| Closed | Day Ronald C | $170,000 | |
| Previous Owner | Day Ronald C | $127,900 |
Source: Public Records
Tax History Compared to Growth
Tax History
| Year | Tax Paid | Tax Assessment Tax Assessment Total Assessment is a certain percentage of the fair market value that is determined by local assessors to be the total taxable value of land and additions on the property. | Land | Improvement |
|---|---|---|---|---|
| 2025 | $5,236 | $412,300 | $114,000 | $298,300 |
| 2024 | $4,833 | $334,000 | $99,100 | $234,900 |
| 2023 | $4,739 | $334,000 | $99,100 | $234,900 |
| 2022 | $4,525 | $241,600 | $62,300 | $179,300 |
| 2021 | $4,525 | $241,600 | $62,300 | $179,300 |
| 2020 | $4,525 | $241,600 | $62,300 | $179,300 |
| 2019 | $4,525 | $241,600 | $62,300 | $179,300 |
| 2018 | $4,185 | $201,200 | $62,300 | $138,900 |
| 2017 | $4,072 | $201,200 | $62,300 | $138,900 |
| 2016 | $4,072 | $201,200 | $62,300 | $138,900 |
| 2015 | $3,810 | $183,600 | $56,400 | $127,200 |
| 2014 | $3,683 | $183,600 | $56,400 | $127,200 |
| 2013 | $3,633 | $183,600 | $56,400 | $127,200 |
Source: Public Records
Map
Nearby Homes