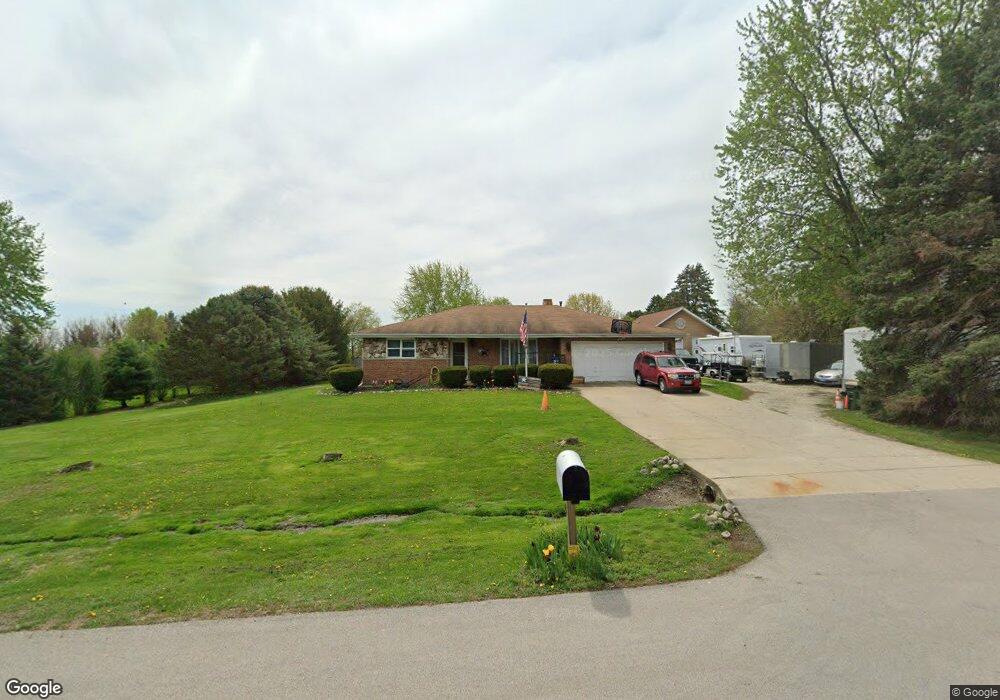
12 Betty Ln Unit 1 Plainfield, IL 60544
Estimated Value: $329,000 - $477,000
--
Bed
--
Bath
1,384
Sq Ft
$287/Sq Ft
Est. Value
About This Home
This home is located at 12 Betty Ln Unit 1, Plainfield, IL 60544 and is currently estimated at $397,558, approximately $287 per square foot. 12 Betty Ln Unit 1 is a home located in Kendall County with nearby schools including Lincoln Elementary School, Richard Ira Jones Middle School, and Plainfield North High School.
Ownership History
Date
Name
Owned For
Owner Type
Purchase Details
Closed on
Jun 14, 2004
Sold by
Pasch Ellen
Bought by
Pasch Kevin and Pasch Ellen
Current Estimated Value
Home Financials for this Owner
Home Financials are based on the most recent Mortgage that was taken out on this home.
Original Mortgage
$193,500
Outstanding Balance
$109,058
Interest Rate
8.35%
Mortgage Type
New Conventional
Estimated Equity
$288,500
Purchase Details
Closed on
Jan 14, 2002
Sold by
Pasch Kevin and Pasch Ellen
Bought by
Pasch Ellen
Home Financials for this Owner
Home Financials are based on the most recent Mortgage that was taken out on this home.
Original Mortgage
$146,400
Interest Rate
9.85%
Purchase Details
Closed on
Oct 25, 1996
Sold by
Porath Howard L and Porath Ann Marie
Bought by
Pasch Kevin and Pasch Ellen
Home Financials for this Owner
Home Financials are based on the most recent Mortgage that was taken out on this home.
Original Mortgage
$142,400
Interest Rate
7.75%
Create a Home Valuation Report for This Property
The Home Valuation Report is an in-depth analysis detailing your home's value as well as a comparison with similar homes in the area
Home Values in the Area
Average Home Value in this Area
Purchase History
| Date | Buyer | Sale Price | Title Company |
|---|---|---|---|
| Pasch Kevin | -- | Chicago Title Insurance Co | |
| Pasch Ellen | -- | -- | |
| Pasch Kevin | $150,000 | First American Title Ins Co |
Source: Public Records
Mortgage History
| Date | Status | Borrower | Loan Amount |
|---|---|---|---|
| Open | Pasch Kevin | $193,500 | |
| Closed | Pasch Ellen | $146,400 | |
| Closed | Pasch Kevin | $142,400 | |
| Closed | Pasch Ellen | $36,600 | |
| Closed | Pasch Kevin | $10,750 |
Source: Public Records
Tax History Compared to Growth
Tax History
| Year | Tax Paid | Tax Assessment Tax Assessment Total Assessment is a certain percentage of the fair market value that is determined by local assessors to be the total taxable value of land and additions on the property. | Land | Improvement |
|---|---|---|---|---|
| 2024 | $5,735 | $92,909 | $15,805 | $77,104 |
| 2023 | $5,536 | $88,088 | $15,052 | $73,036 |
| 2022 | $5,536 | $81,596 | $13,557 | $68,039 |
| 2021 | $5,387 | $78,217 | $13,763 | $64,454 |
| 2020 | $5,153 | $73,575 | $12,946 | $60,629 |
| 2019 | $5,247 | $73,575 | $12,946 | $60,629 |
| 2018 | $5,084 | $70,485 | $12,946 | $57,539 |
| 2017 | $5,031 | $66,696 | $12,250 | $54,446 |
| 2016 | $4,737 | $61,954 | $12,099 | $49,855 |
| 2015 | $4,981 | $61,954 | $12,099 | $49,855 |
| 2014 | -- | $56,949 | $12,099 | $44,850 |
| 2013 | -- | $56,949 | $12,099 | $44,850 |
Source: Public Records
Map
Nearby Homes
- 15234 S Hepworth Ct
- 15137 S Hepworth Ct
- 15226 S Hepworth Ct
- 15230 S Hepworth Ct
- 15236 S Hepworth Ct
- Charlotte Plan at Autumn Glen - Traditional Townhomes
- Chelsea Plan at Autumn Glen - Urban Townhomes
- Marianne Plan at Autumn Glen - Traditional Townhomes
- Chatham Plan at Autumn Glen - Urban Townhomes
- Darcy Plan at Autumn Glen - Traditional Townhomes
- Amherst Plan at Autumn Glen - Urban Townhomes
- 25646 W Yorkshire Dr
- 25656 W Yorkshire Cir
- 25747 W Yorkshire Cir
- 25660 W Yorkshire Dr
- 25730 W Yorkshire Dr
- 25664 W Yorkshire Dr
- 25729 W Yorkshire Dr
- 15238 S Hepworth Place
- 25743 W Yorkshire Dr
- 23 S Viking Blvd
- 20 Betty Ln
- 33 S Viking Blvd Unit 1
- 15 Betty Ln Unit 1
- 5 Betty Ln
- 21 Betty Ln
- 41 S Viking Blvd
- 16 S Viking Blvd Unit 1
- 6 W Andy Ct Unit 1
- 4 S Viking Blvd
- 508 W Route 126 Hwy
- 508 State Route 126
- 508 State Route 126
- 5 W Andy Ct
- 14 W Andy Ct
- 13 W Andy Ct Unit 1
- 18 W Andy Ct
- 17 W Andy Ct
- 800 State Route 126
- 8100 S Ridge Rd