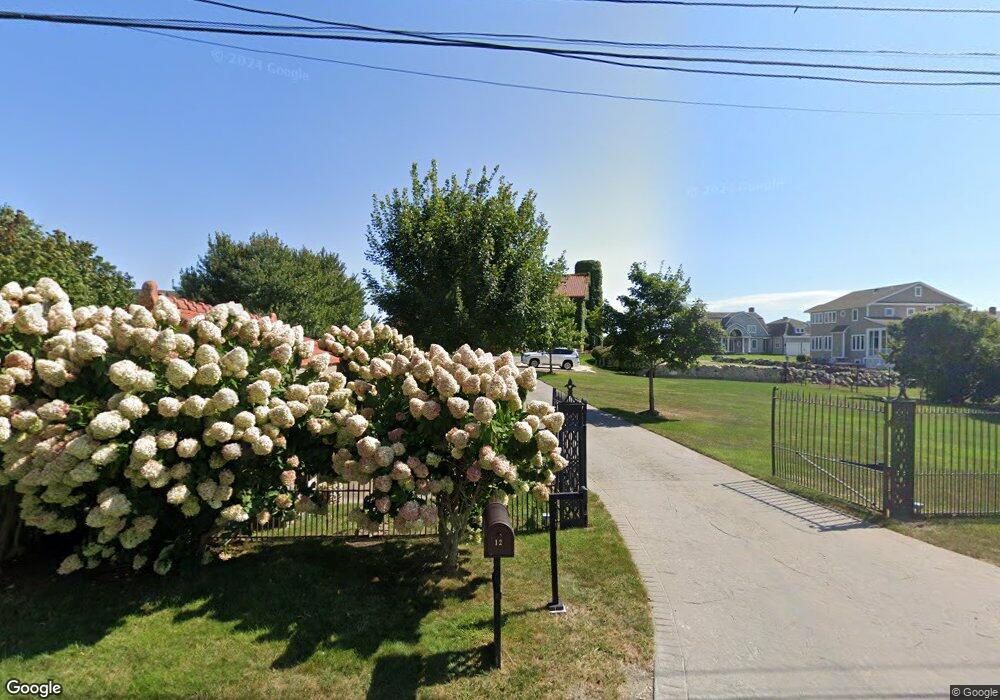
12 Billow Rd Old Saybrook, CT 06475
Estimated Value: $3,864,000 - $7,599,338
10
Beds
9
Baths
12,023
Sq Ft
$500/Sq Ft
Est. Value
About This Home
This home is located at 12 Billow Rd, Old Saybrook, CT 06475 and is currently estimated at $6,008,779, approximately $499 per square foot. 12 Billow Rd is a home located in Middlesex County with nearby schools including Kathleen E. Goodwin School, Old Saybrook Middle School, and Old Saybrook Senior High School.
Ownership History
Date
Name
Owned For
Owner Type
Purchase Details
Closed on
Jan 11, 2007
Sold by
Old Saybrook Castle Ll
Bought by
Rand William and Foss-Rand Maria
Current Estimated Value
Purchase Details
Closed on
Dec 1, 2005
Sold by
Beach Investments Llc
Bought by
12 Billow Assoc
Purchase Details
Closed on
Dec 3, 1999
Sold by
Macdaniel Ronald A
Bought by
Beach Inv Llc
Purchase Details
Closed on
Jan 28, 1994
Sold by
Garfield David
Bought by
Macdaniel Ronald
Create a Home Valuation Report for This Property
The Home Valuation Report is an in-depth analysis detailing your home's value as well as a comparison with similar homes in the area
Home Values in the Area
Average Home Value in this Area
Purchase History
| Date | Buyer | Sale Price | Title Company |
|---|---|---|---|
| Rand William | $2,051,500 | -- | |
| Rand William | $2,051,500 | -- | |
| 12 Billow Assoc | $2,075,000 | -- | |
| 12 Billow Assoc | $2,075,000 | -- | |
| Beach Inv Llc | $2,250,000 | -- | |
| Macdaniel Ronald | $500,000 | -- |
Source: Public Records
Mortgage History
| Date | Status | Borrower | Loan Amount |
|---|---|---|---|
| Open | Macdaniel Ronald | $450,000 | |
| Open | Macdaniel Ronald | $2,227,912 |
Source: Public Records
Tax History Compared to Growth
Tax History
| Year | Tax Paid | Tax Assessment Tax Assessment Total Assessment is a certain percentage of the fair market value that is determined by local assessors to be the total taxable value of land and additions on the property. | Land | Improvement |
|---|---|---|---|---|
| 2025 | $56,820 | $3,665,800 | $1,050,500 | $2,615,300 |
| 2024 | $55,720 | $3,665,800 | $1,050,500 | $2,615,300 |
| 2023 | $50,051 | $2,447,500 | $673,500 | $1,774,000 |
| 2022 | $49,146 | $2,447,500 | $673,500 | $1,774,000 |
| 2021 | $49,072 | $2,447,500 | $673,500 | $1,774,000 |
| 2020 | $49,072 | $2,447,500 | $673,500 | $1,774,000 |
| 2019 | $48,340 | $2,447,600 | $673,600 | $1,774,000 |
| 2018 | $48,079 | $2,453,000 | $734,700 | $1,718,300 |
| 2017 | $48,226 | $2,453,000 | $734,700 | $1,718,300 |
| 2016 | $47,245 | $2,453,000 | $734,700 | $1,718,300 |
| 2015 | $46,141 | $2,453,000 | $734,700 | $1,718,300 |
| 2014 | $45,381 | $2,453,000 | $734,700 | $1,718,300 |
Source: Public Records
Map
Nearby Homes