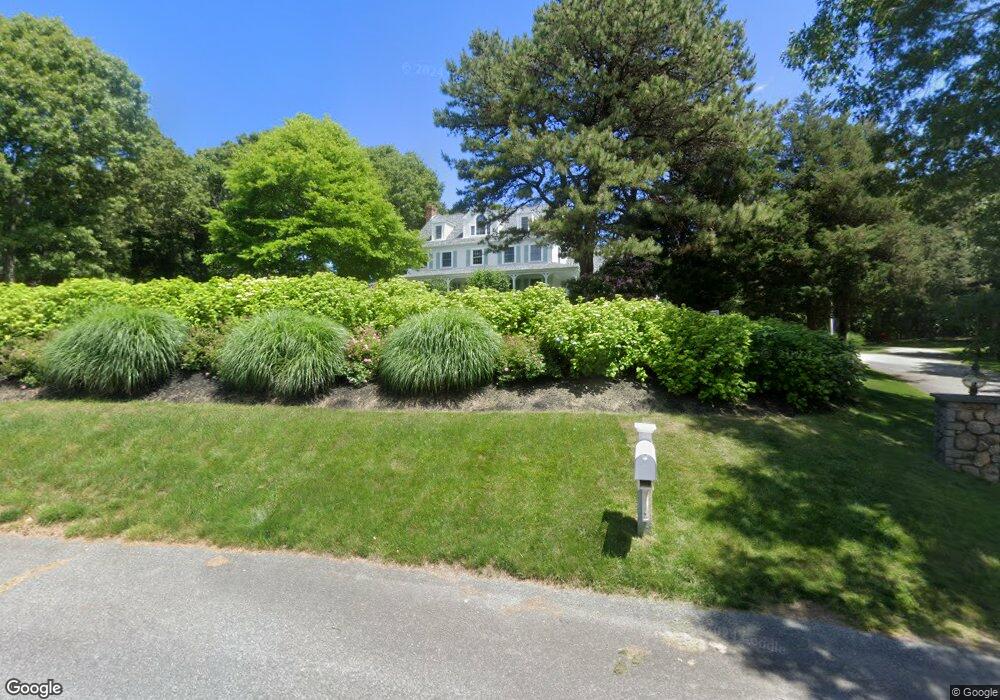
12 Briar Ln West Barnstable, MA 02668
West Barnstable NeighborhoodEstimated Value: $2,034,000 - $2,388,000
4
Beds
4
Baths
3,152
Sq Ft
$695/Sq Ft
Est. Value
About This Home
This home is located at 12 Briar Ln, West Barnstable, MA 02668 and is currently estimated at $2,190,010, approximately $694 per square foot. 12 Briar Ln is a home located in Barnstable County with nearby schools including West Barnstable Elementary School, Barnstable United Elementary School, and Barnstable Intermediate School.
Ownership History
Date
Name
Owned For
Owner Type
Purchase Details
Closed on
Jun 1, 1993
Sold by
Crosby Marjorie H
Bought by
Bess Joel F and Bess Katy M
Current Estimated Value
Create a Home Valuation Report for This Property
The Home Valuation Report is an in-depth analysis detailing your home's value as well as a comparison with similar homes in the area
Home Values in the Area
Average Home Value in this Area
Purchase History
| Date | Buyer | Sale Price | Title Company |
|---|---|---|---|
| Bess Joel F | $73,500 | -- |
Source: Public Records
Mortgage History
| Date | Status | Borrower | Loan Amount |
|---|---|---|---|
| Open | Bess Joel F | $40,000 | |
| Open | Bess Joel F | $412,000 | |
| Closed | Bess Joel F | $262,000 |
Source: Public Records
Tax History
| Year | Tax Paid | Tax Assessment Tax Assessment Total Assessment is a certain percentage of the fair market value that is determined by local assessors to be the total taxable value of land and additions on the property. | Land | Improvement |
|---|---|---|---|---|
| 2025 | $17,892 | $1,915,600 | $749,300 | $1,166,300 |
| 2024 | $13,656 | $1,591,600 | $571,300 | $1,020,300 |
| 2023 | $14,290 | $1,568,600 | $676,500 | $892,100 |
| 2022 | $12,608 | $1,134,800 | $389,200 | $745,600 |
| 2021 | $12,963 | $1,106,100 | $415,100 | $691,000 |
| 2020 | $11,401 | $940,700 | $331,800 | $608,900 |
| 2019 | $11,659 | $949,400 | $331,800 | $617,600 |
| 2018 | $11,296 | $911,700 | $363,200 | $548,500 |
| 2017 | $10,873 | $888,300 | $377,100 | $511,200 |
| 2016 | $10,639 | $887,300 | $376,100 | $511,200 |
| 2015 | $9,942 | $831,300 | $361,000 | $470,300 |
Source: Public Records
Map
Nearby Homes
- 3 Mulberry Cir
- 4 Wing Blvd
- 50 Wayside Ln
- 0 Captain Kidd Rd
- 566 Route 6a
- 510 Cedar St
- 75 Old Toll Rd
- 6 Harpers Hollow
- 46 Service Rd
- 507 Route 6a Unit 9
- 29 Fish House Rd
- 159 Great Hill Rd
- 174 N Shore Blvd Unit 1
- 19 Cedarville Rd
- 282 Parker Rd
- 84 White Birch Way
- 4 Cowslip Path
- 390 Massachusetts 6a
- 2 Marie Ln
- 21 Quiet St
Your Personal Tour Guide
Ask me questions while you tour the home.