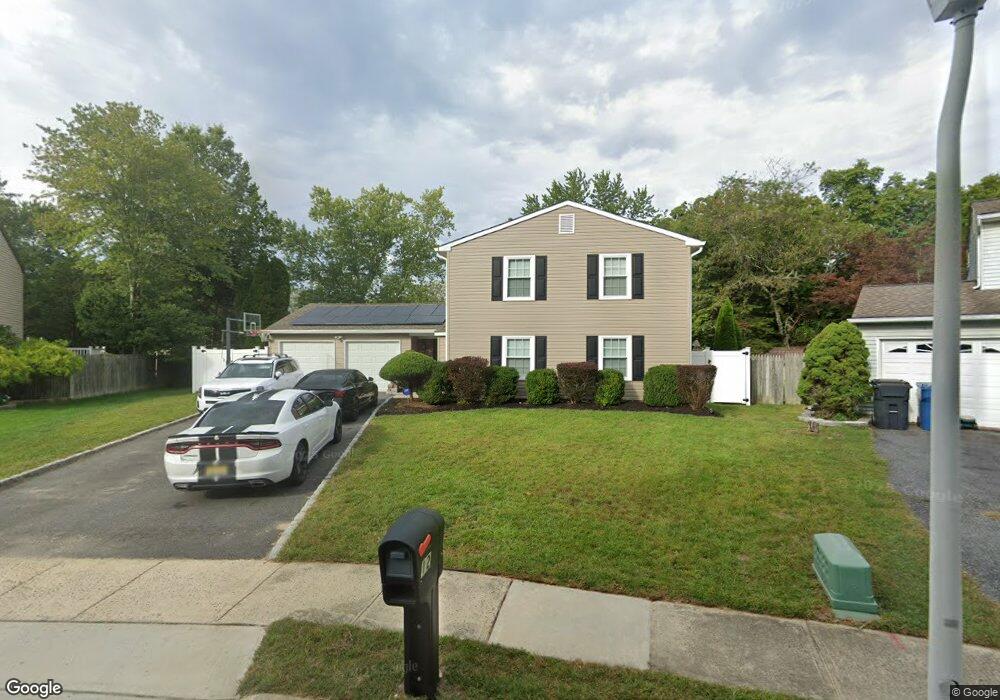
12 Bugle Ct Howell, NJ 07731
Southard NeighborhoodEstimated Value: $702,000 - $754,000
4
Beds
3
Baths
2,032
Sq Ft
$361/Sq Ft
Est. Value
About This Home
This home is located at 12 Bugle Ct, Howell, NJ 07731 and is currently estimated at $733,570, approximately $361 per square foot. 12 Bugle Ct is a home located in Monmouth County with nearby schools including Taunton School, Aldrich School, and Howell Township Middle School South.
Ownership History
Date
Name
Owned For
Owner Type
Purchase Details
Closed on
May 29, 2010
Sold by
Khan Fazal and Khan Alia
Bought by
Wright Wendell E
Current Estimated Value
Home Financials for this Owner
Home Financials are based on the most recent Mortgage that was taken out on this home.
Original Mortgage
$314,202
Outstanding Balance
$209,647
Interest Rate
4.88%
Mortgage Type
FHA
Estimated Equity
$523,923
Purchase Details
Closed on
Oct 7, 2002
Sold by
Hinkelbein Arthur
Bought by
Khan Fazal
Home Financials for this Owner
Home Financials are based on the most recent Mortgage that was taken out on this home.
Original Mortgage
$245,000
Interest Rate
6.03%
Create a Home Valuation Report for This Property
The Home Valuation Report is an in-depth analysis detailing your home's value as well as a comparison with similar homes in the area
Home Values in the Area
Average Home Value in this Area
Purchase History
| Date | Buyer | Sale Price | Title Company |
|---|---|---|---|
| Wright Wendell E | $319,999 | None Available | |
| Khan Fazal | $275,000 | -- |
Source: Public Records
Mortgage History
| Date | Status | Borrower | Loan Amount |
|---|---|---|---|
| Open | Wright Wendell E | $314,202 | |
| Previous Owner | Khan Fazal | $245,000 |
Source: Public Records
Tax History
| Year | Tax Paid | Tax Assessment Tax Assessment Total Assessment is a certain percentage of the fair market value that is determined by local assessors to be the total taxable value of land and additions on the property. | Land | Improvement |
|---|---|---|---|---|
| 2025 | $11,379 | $697,900 | $378,000 | $319,900 |
| 2024 | $10,844 | $640,000 | $326,000 | $314,000 |
| 2023 | $10,844 | $582,700 | $276,000 | $306,700 |
| 2022 | $9,544 | $453,000 | $161,000 | $292,000 |
| 2021 | $9,544 | $415,700 | $156,000 | $259,700 |
| 2020 | $9,334 | $402,000 | $145,200 | $256,800 |
| 2019 | $9,663 | $408,400 | $156,000 | $252,400 |
| 2018 | $8,969 | $376,700 | $136,000 | $240,700 |
| 2017 | $9,182 | $381,300 | $131,000 | $250,300 |
| 2016 | $8,755 | $360,000 | $116,000 | $244,000 |
| 2015 | $8,690 | $353,700 | $116,000 | $237,700 |
| 2014 | $7,809 | $294,900 | $106,000 | $188,900 |
Source: Public Records
Map
Nearby Homes
Your Personal Tour Guide
Ask me questions while you tour the home.