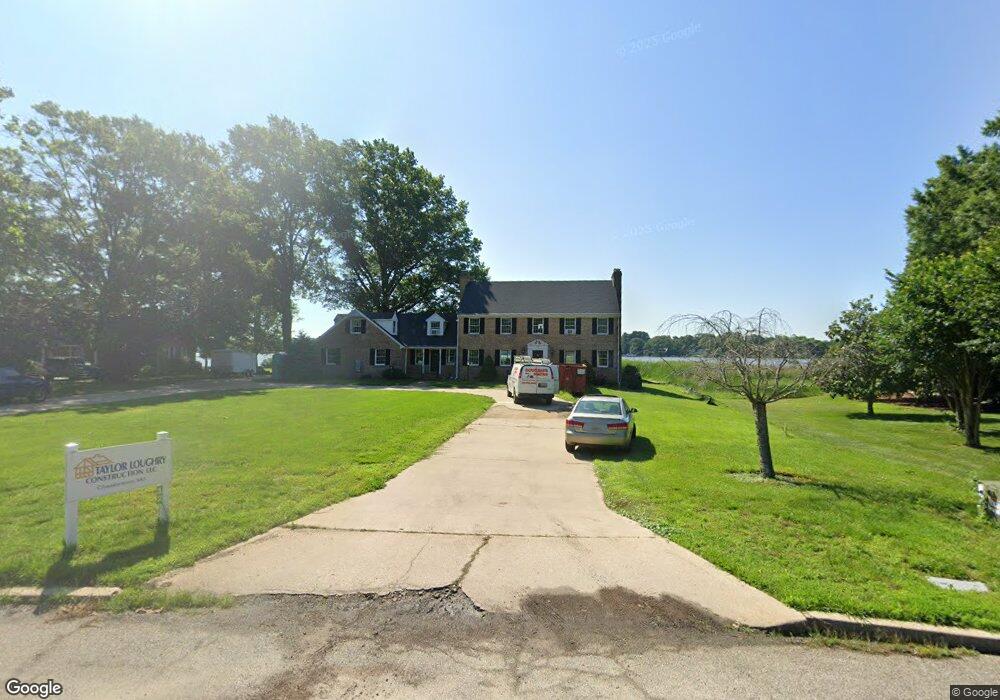
12 Byford Ct Chestertown, MD 21620
Estimated Value: $1,178,680 - $1,301,000
--
Bed
3
Baths
3,654
Sq Ft
$336/Sq Ft
Est. Value
About This Home
This home is located at 12 Byford Ct, Chestertown, MD 21620 and is currently estimated at $1,228,420, approximately $336 per square foot. 12 Byford Ct is a home located in Kent County with nearby schools including Center for Innovation, Kent County Middle School, and Kent County High School.
Ownership History
Date
Name
Owned For
Owner Type
Purchase Details
Closed on
Nov 19, 2024
Sold by
Bypass Trust and Robert E Townsend Jr Revocable Trust
Bought by
Rice Peter P and Spry Rice Brittani
Current Estimated Value
Home Financials for this Owner
Home Financials are based on the most recent Mortgage that was taken out on this home.
Original Mortgage
$1,034,885
Outstanding Balance
$1,024,965
Interest Rate
6.32%
Mortgage Type
New Conventional
Estimated Equity
$203,455
Purchase Details
Closed on
Feb 21, 2024
Sold by
Robert E Townsend Jr Revocable Trust and Townsend Lois N
Bought by
Robert E Townsend Jr Revocable Trust and Townsend
Purchase Details
Closed on
Aug 26, 2011
Sold by
Townsend Robert E and Townsend Lois N
Bought by
Townsend Robert E and Townsend Lois N
Purchase Details
Closed on
Nov 14, 2008
Sold by
Townsend Robert E and Townsend Lois
Bought by
Townsend Robert E and Townsend Lois
Create a Home Valuation Report for This Property
The Home Valuation Report is an in-depth analysis detailing your home's value as well as a comparison with similar homes in the area
Home Values in the Area
Average Home Value in this Area
Purchase History
| Date | Buyer | Sale Price | Title Company |
|---|---|---|---|
| Rice Peter P | $1,150,000 | None Listed On Document | |
| Robert E Townsend Jr Revocable Trust | -- | None Listed On Document | |
| Townsend Robert E | -- | None Available | |
| Townsend Robert E | -- | -- | |
| Townsend Robert E | -- | -- |
Source: Public Records
Mortgage History
| Date | Status | Borrower | Loan Amount |
|---|---|---|---|
| Open | Rice Peter P | $1,034,885 |
Source: Public Records
Tax History Compared to Growth
Tax History
| Year | Tax Paid | Tax Assessment Tax Assessment Total Assessment is a certain percentage of the fair market value that is determined by local assessors to be the total taxable value of land and additions on the property. | Land | Improvement |
|---|---|---|---|---|
| 2025 | $14,130 | $901,600 | $481,000 | $420,600 |
| 2024 | $13,655 | $871,267 | $0 | $0 |
| 2023 | $13,179 | $840,933 | $0 | $0 |
| 2022 | $12,623 | $810,600 | $481,000 | $329,600 |
| 2021 | $12,567 | $806,233 | $0 | $0 |
| 2020 | $12,567 | $801,867 | $0 | $0 |
| 2019 | $12,473 | $797,500 | $481,000 | $316,500 |
| 2018 | $12,393 | $797,500 | $481,000 | $316,500 |
| 2017 | $11,218 | $797,500 | $0 | $0 |
| 2016 | -- | $797,500 | $0 | $0 |
| 2015 | $11,448 | $797,500 | $0 | $0 |
| 2014 | $11,448 | $797,500 | $0 | $0 |
Source: Public Records
Map
Nearby Homes
- 303 E Campus Ave
- 0 East St
- 200 Washington Ave
- 105 High St
- 206 Valley Rd
- 228 S Water St
- 349 & 351 High St
- 222 Mount Vernon Ave
- 206 S Water St
- 349 High St
- 204 Rolling Rd
- 206 Cannon St
- 411 Greenwood Ave
- 0 Elm St Unit MDKE2003590
- 234 N College Ave
- 517 High St
- 423 Calvert St
- 109 S College Ave
- 141 Prospect St
- 611 Cannon St