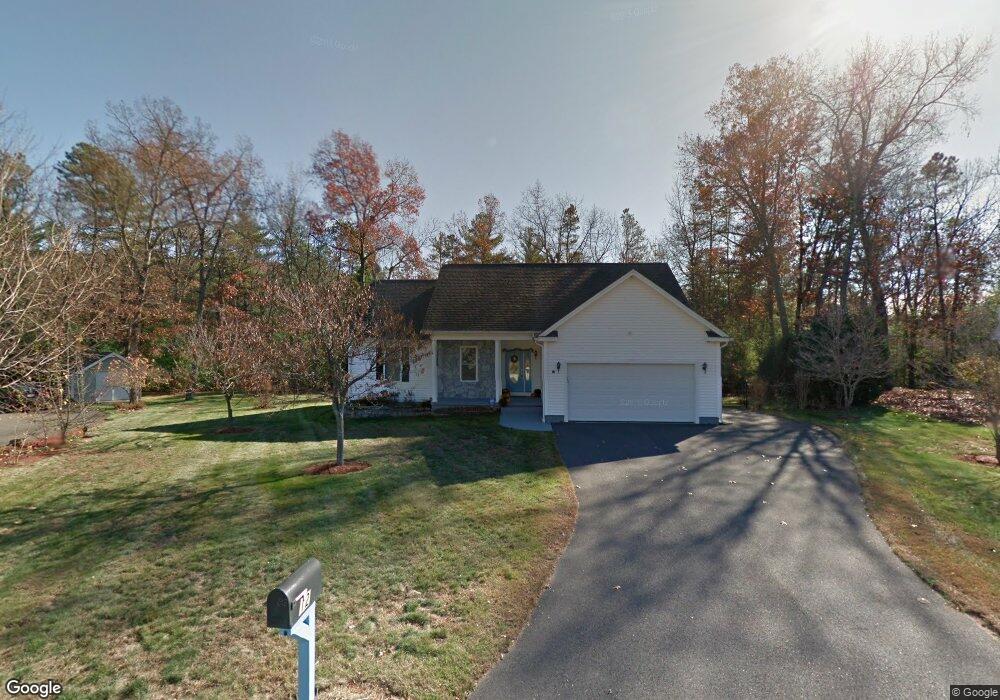
12 Camelot Ln Easthampton, MA 01027
Estimated Value: $518,000 - $584,000
3
Beds
3
Baths
1,585
Sq Ft
$340/Sq Ft
Est. Value
About This Home
This home is located at 12 Camelot Ln, Easthampton, MA 01027 and is currently estimated at $538,561, approximately $339 per square foot. 12 Camelot Ln is a home located in Hampshire County with nearby schools including Easthampton High School, Calvary Baptist Christian School, and Tri-County Schools.
Ownership History
Date
Name
Owned For
Owner Type
Purchase Details
Closed on
Jan 4, 2017
Sold by
Lentner Richard J
Bought by
Lentner Debra A
Current Estimated Value
Purchase Details
Closed on
Jan 31, 2003
Sold by
Czelusniak Custom Home
Bought by
Lentner Debra A and Lentner Richard J
Home Financials for this Owner
Home Financials are based on the most recent Mortgage that was taken out on this home.
Original Mortgage
$225,900
Interest Rate
6.09%
Mortgage Type
Purchase Money Mortgage
Create a Home Valuation Report for This Property
The Home Valuation Report is an in-depth analysis detailing your home's value as well as a comparison with similar homes in the area
Home Values in the Area
Average Home Value in this Area
Purchase History
| Date | Buyer | Sale Price | Title Company |
|---|---|---|---|
| Lentner Debra A | -- | -- | |
| Lentner Debra A | $251,000 | -- |
Source: Public Records
Mortgage History
| Date | Status | Borrower | Loan Amount |
|---|---|---|---|
| Previous Owner | Lentner Debra A | $225,900 |
Source: Public Records
Tax History Compared to Growth
Tax History
| Year | Tax Paid | Tax Assessment Tax Assessment Total Assessment is a certain percentage of the fair market value that is determined by local assessors to be the total taxable value of land and additions on the property. | Land | Improvement |
|---|---|---|---|---|
| 2025 | $6,415 | $469,300 | $123,600 | $345,700 |
| 2024 | $6,196 | $456,900 | $120,000 | $336,900 |
| 2023 | $4,641 | $316,800 | $95,100 | $221,700 |
| 2022 | $5,237 | $316,800 | $95,100 | $221,700 |
| 2021 | $5,751 | $327,900 | $95,100 | $232,800 |
| 2020 | $5,626 | $316,800 | $95,100 | $221,700 |
| 2019 | $4,694 | $303,600 | $95,100 | $208,500 |
| 2018 | $4,483 | $280,200 | $89,500 | $190,700 |
| 2017 | $4,380 | $270,200 | $86,100 | $184,100 |
| 2016 | $4,371 | $280,400 | $86,100 | $194,300 |
| 2015 | $4,248 | $280,400 | $86,100 | $194,300 |
Source: Public Records
Map
Nearby Homes