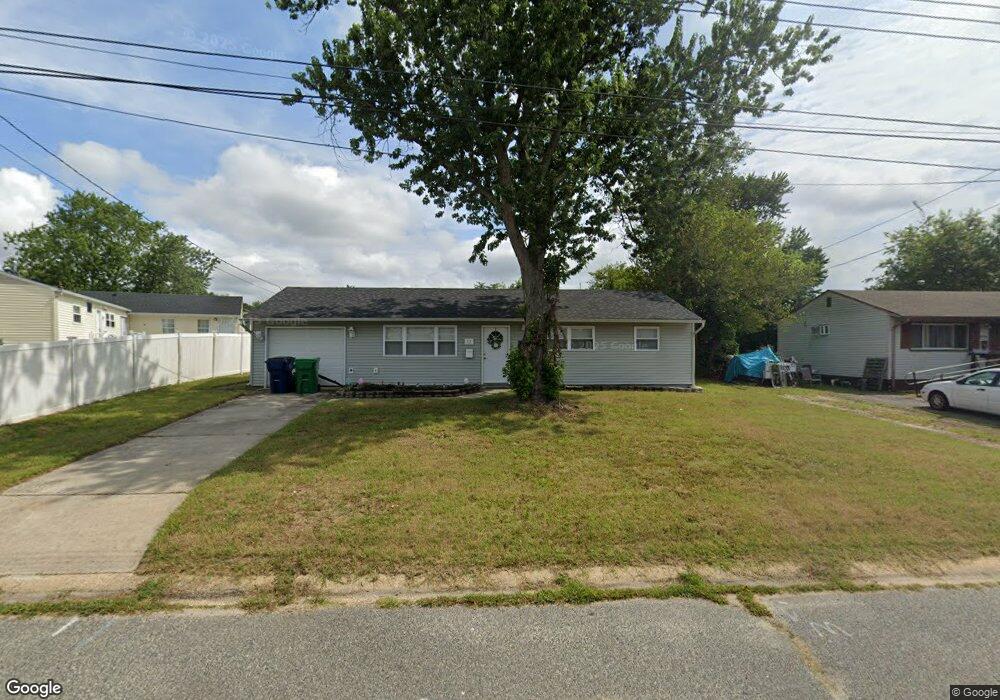
12 Carnegie St Toms River, NJ 08757
Estimated Value: $361,867 - $417,000
4
Beds
2
Baths
1,140
Sq Ft
$344/Sq Ft
Est. Value
About This Home
This home is located at 12 Carnegie St, Toms River, NJ 08757 and is currently estimated at $391,717, approximately $343 per square foot. 12 Carnegie St is a home located in Ocean County with nearby schools including St Joseph Grade School, Ambassador Christian Academy, and Ocean Academy.
Ownership History
Date
Name
Owned For
Owner Type
Purchase Details
Closed on
Feb 8, 2021
Sold by
Dhir Sunil
Bought by
Ralph Jamel
Current Estimated Value
Home Financials for this Owner
Home Financials are based on the most recent Mortgage that was taken out on this home.
Original Mortgage
$243,182
Outstanding Balance
$217,311
Interest Rate
2.65%
Mortgage Type
New Conventional
Estimated Equity
$174,406
Purchase Details
Closed on
Oct 12, 2020
Sold by
Aviles Anibal and Aviles Maria
Bought by
Dhir Sunil
Purchase Details
Closed on
Jul 30, 2001
Sold by
Conover Carl
Bought by
Aviles Anibal and Aviles Maria
Home Financials for this Owner
Home Financials are based on the most recent Mortgage that was taken out on this home.
Original Mortgage
$111,650
Interest Rate
6.98%
Mortgage Type
FHA
Create a Home Valuation Report for This Property
The Home Valuation Report is an in-depth analysis detailing your home's value as well as a comparison with similar homes in the area
Home Values in the Area
Average Home Value in this Area
Purchase History
| Date | Buyer | Sale Price | Title Company |
|---|---|---|---|
| Ralph Jamel | $239,000 | Counsellors Title Agency Inc | |
| Dhir Sunil | $800,000 | None Available | |
| Dhir Sunil | $80,000 | None Listed On Document | |
| Aviles Anibal | $115,000 | -- |
Source: Public Records
Mortgage History
| Date | Status | Borrower | Loan Amount |
|---|---|---|---|
| Open | Ralph Jamel | $243,182 | |
| Previous Owner | Aviles Anibal | $111,650 |
Source: Public Records
Tax History Compared to Growth
Tax History
| Year | Tax Paid | Tax Assessment Tax Assessment Total Assessment is a certain percentage of the fair market value that is determined by local assessors to be the total taxable value of land and additions on the property. | Land | Improvement |
|---|---|---|---|---|
| 2025 | $5,974 | $181,800 | $66,300 | $115,500 |
| 2024 | $5,763 | $181,800 | $66,300 | $115,500 |
| 2023 | $5,616 | $181,800 | $66,300 | $115,500 |
| 2022 | $5,616 | $181,800 | $66,300 | $115,500 |
| 2021 | $5,292 | $128,300 | $66,300 | $62,000 |
| 2020 | $3,830 | $128,300 | $66,300 | $62,000 |
| 2019 | $3,793 | $128,300 | $66,300 | $62,000 |
| 2018 | $3,725 | $128,300 | $66,300 | $62,000 |
| 2017 | $3,673 | $128,300 | $66,300 | $62,000 |
| 2016 | $3,585 | $128,300 | $66,300 | $62,000 |
| 2015 | $4,407 | $201,900 | $100,000 | $101,900 |
| 2014 | $4,242 | $201,900 | $100,000 | $101,900 |
Source: Public Records
Map
Nearby Homes