
Landlord's Agent in 2024
Dan Li
Keller Williams Realty
(617) 855-5121
180 Total Sales


Estimated Value: $2,833,000 - $3,618,000
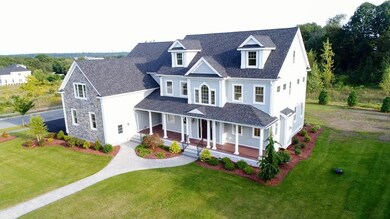
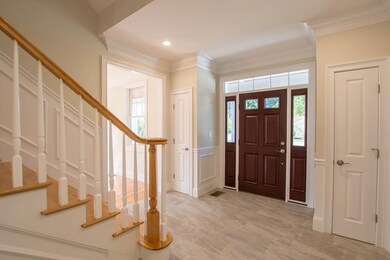
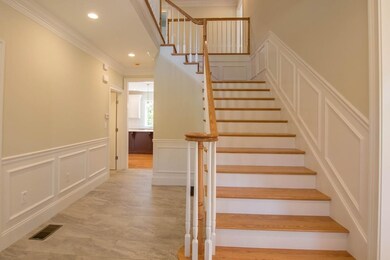
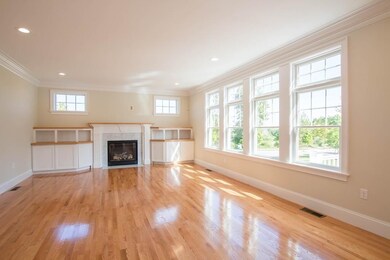
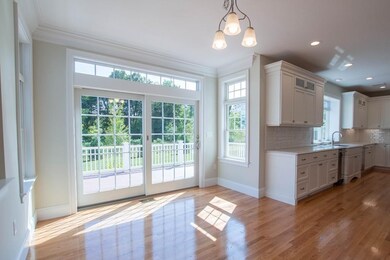
This luxury 6 BD/5 BA house is located in one of Lexington's finest neighborhoods. The spacious light-filled family room, gracious living room, banquet size dining room and gorgeous kitchen complete the first floor. Custom features include a beautiful gourmet eat in kitchen with marble counter tops, high end appliances, and fabulous outside dining options from the deck. Five generous bedrooms sit in the 2nd level, include a luxurious master suite featuring tray ceiling, a large sitting area and walk in closet. The 3rd level is perfect for use as an office or a teen suite w/sixth bedroom plus a full bath. Less than 5 mins driving to grocery stores (Star Market, Wagon Wheel, etc), Waltham Plaza Shopping Center, TJ Maxx, Staples, CVS, restaurants and banks. Easy access to Route-2 and I-95.
| Date | Buyer | Sale Price | Title Company |
|---|---|---|---|
| Jiang Yabing | $2,200,000 | -- |
| Date | Event | Price | List to Sale | Price per Sq Ft | Prior Sale |
|---|---|---|---|---|---|
| 10/27/2024 10/27/24 | Rented | $11,800 | 0.0% | -- | |
| 09/19/2024 09/19/24 | Under Contract | -- | -- | -- | |
| 09/13/2024 09/13/24 | For Rent | $11,800 | 0.0% | -- | |
| 08/25/2023 08/25/23 | Rented | $11,800 | 0.0% | -- | |
| 07/09/2023 07/09/23 | Under Contract | -- | -- | -- | |
| 07/05/2023 07/05/23 | For Rent | $11,800 | 0.0% | -- | |
| 09/01/2022 09/01/22 | Rented | $11,800 | 0.0% | -- | |
| 08/02/2022 08/02/22 | Under Contract | -- | -- | -- | |
| 07/27/2022 07/27/22 | For Rent | $11,800 | +18.0% | -- | |
| 09/15/2021 09/15/21 | Rented | -- | -- | -- | |
| 08/30/2021 08/30/21 | Under Contract | -- | -- | -- | |
| 07/17/2021 07/17/21 | For Rent | $10,000 | +11.1% | -- | |
| 03/01/2020 03/01/20 | Rented | $9,000 | -10.0% | -- | |
| 02/09/2020 02/09/20 | Under Contract | -- | -- | -- | |
| 01/02/2020 01/02/20 | For Rent | $10,000 | +11.1% | -- | |
| 02/13/2019 02/13/19 | Rented | $9,000 | -10.0% | -- | |
| 12/19/2018 12/19/18 | For Rent | $10,000 | 0.0% | -- | |
| 12/13/2018 12/13/18 | Sold | $2,200,000 | -4.1% | $396 / Sq Ft | View Prior Sale |
| 10/03/2018 10/03/18 | Pending | -- | -- | -- | |
| 06/06/2018 06/06/18 | Price Changed | $2,295,000 | -4.2% | $413 / Sq Ft | |
| 04/13/2018 04/13/18 | Price Changed | $2,395,000 | -4.0% | $431 / Sq Ft | |
| 09/05/2017 09/05/17 | For Sale | $2,495,000 | -- | $449 / Sq Ft |
| Year | Tax Paid | Tax Assessment Tax Assessment Total Assessment is a certain percentage of the fair market value that is determined by local assessors to be the total taxable value of land and additions on the property. | Land | Improvement |
|---|---|---|---|---|
| 2025 | $34,611 | $2,830,000 | $937,000 | $1,893,000 |
| 2024 | $33,014 | $2,695,000 | $915,000 | $1,780,000 |
| 2023 | $30,927 | $2,379,000 | $832,000 | $1,547,000 |
| 2022 | $30,098 | $2,181,000 | $757,000 | $1,424,000 |
| 2021 | $31,140 | $2,164,000 | $751,000 | $1,413,000 |
| 2020 | $28,873 | $2,055,000 | $751,000 | $1,304,000 |
| 2019 | $27,689 | $1,961,000 | $715,000 | $1,246,000 |
| 2018 | $23,323 | $1,631,000 | $610,000 | $1,021,000 |
| 2017 | $13,490 | $931,000 | $597,000 | $334,000 |
| 2016 | $4,979 | $341,000 | $341,000 | $0 |
| 2015 | $4,607 | $310,000 | $310,000 | $0 |
| 2014 | $4,265 | $275,000 | $275,000 | $0 |
Landlord's Agent in 2024
Dan Li
Keller Williams Realty
(617) 855-5121
180 Total Sales
S
Tenant's Agent in 2024
Sundara Rattet
eXp Realty
(617) 935-6360
Buyer's Agent in 2023
Alison Borrelli
Berkshire Hathaway HomeServices Commonwealth Real Estate
(617) 257-3012
90 Total Sales
Buyer's Agent in 2022
Mac Chinsomboon
Coldwell Banker Realty - Boston
(617) 905-6622
86 Total Sales
Buyer's Agent in 2021
Diamond Hayes
William Raveis R.E. & Home Services
(617) 899-1752
23 Total Sales
J
Buyer's Agent in 2020
Jenny Chang
HyRoad Realty, LLC
(978) 394-2128
12 Total Sales
Source: MLS Property Information Network (MLS PIN)
MLS Number: 73290082
APN: LEXI-000002-000000-000001T
Disclaimer: Certain information contained herein is derived from information provided by parties other than Homes.com. All information provided is deemed reliable, but is not guaranteed to be accurate and should be independently verified.
![]() The property listing data and information, or the Images, set forth herein were provided to MLS Property Information Network, Inc. from third party sources, including sellers, lessors and public records, and were compiled by MLS Property Information Network, Inc. The property listing data and information, and the Images, are for the personal, non-commercial use of consumers having a good faith interest in purchasing or leasing listed properties of the type displayed to them and may not be used for any purpose other than to identify prospective properties which such consumers may have a good faith interest in purchasing or leasing. MLS Property Information Network, Inc. and its subscribers disclaim any and all representations and warranties as to the accuracy of the property listing data and information, or as to the accuracy of any of the Images, set forth herein.
The property listing data and information, or the Images, set forth herein were provided to MLS Property Information Network, Inc. from third party sources, including sellers, lessors and public records, and were compiled by MLS Property Information Network, Inc. The property listing data and information, and the Images, are for the personal, non-commercial use of consumers having a good faith interest in purchasing or leasing listed properties of the type displayed to them and may not be used for any purpose other than to identify prospective properties which such consumers may have a good faith interest in purchasing or leasing. MLS Property Information Network, Inc. and its subscribers disclaim any and all representations and warranties as to the accuracy of the property listing data and information, or as to the accuracy of any of the Images, set forth herein.