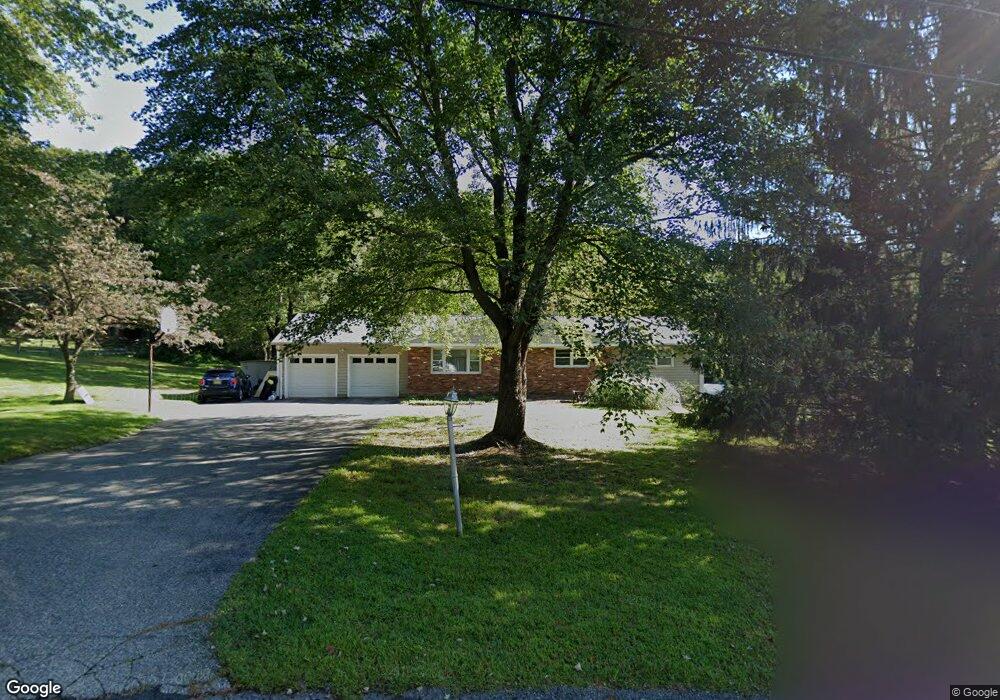
12 Catan Dr Flanders, NJ 07836
Estimated Value: $555,559 - $782,000
Studio
--
Bath
1,476
Sq Ft
$446/Sq Ft
Est. Value
About This Home
This home is located at 12 Catan Dr, Flanders, NJ 07836 and is currently estimated at $658,140, approximately $445 per square foot. 12 Catan Dr is a home located in Morris County with nearby schools including Dickerson School, Bragg School, and Black River Middle School.
Ownership History
Date
Name
Owned For
Owner Type
Purchase Details
Closed on
Nov 8, 2023
Sold by
Keinan Yoram and Shalita-Keinan Zoey
Bought by
Shalita-Keinan Zoey
Current Estimated Value
Purchase Details
Closed on
Aug 23, 2007
Sold by
Oneill James and Oneill Margaret
Bought by
Keinan Yoram and Shalita Keinan Zoey
Home Financials for this Owner
Home Financials are based on the most recent Mortgage that was taken out on this home.
Original Mortgage
$400,000
Interest Rate
6.71%
Mortgage Type
Purchase Money Mortgage
Purchase Details
Closed on
Aug 25, 2000
Sold by
Mcginniss Leighann and Mcginnis Joseph J
Bought by
Oneill James F and Oneill Margaret B
Home Financials for this Owner
Home Financials are based on the most recent Mortgage that was taken out on this home.
Original Mortgage
$260,000
Interest Rate
8.16%
Purchase Details
Closed on
Nov 2, 1995
Sold by
Duhe John and Duhe Pamela
Bought by
Mcginnis Leighann
Create a Home Valuation Report for This Property
The Home Valuation Report is an in-depth analysis detailing your home's value as well as a comparison with similar homes in the area
Home Values in the Area
Average Home Value in this Area
Purchase History
| Date | Buyer | Sale Price | Title Company |
|---|---|---|---|
| Shalita-Keinan Zoey | -- | None Listed On Document | |
| Keinan Yoram | $510,000 | None Available | |
| Oneill James F | $325,000 | Old Republic Natl Title Ins | |
| Mcginnis Leighann | $235,000 | -- |
Source: Public Records
Mortgage History
| Date | Status | Borrower | Loan Amount |
|---|---|---|---|
| Previous Owner | Keinan Yoram | $400,000 | |
| Previous Owner | Oneill James F | $260,000 |
Source: Public Records
Tax History
| Year | Tax Paid | Tax Assessment Tax Assessment Total Assessment is a certain percentage of the fair market value that is determined by local assessors to be the total taxable value of land and additions on the property. | Land | Improvement |
|---|---|---|---|---|
| 2025 | $11,032 | $425,300 | $223,100 | $202,200 |
| 2024 | $10,781 | $425,300 | $223,100 | $202,200 |
| 2023 | $10,781 | $425,300 | $223,100 | $202,200 |
| 2022 | $10,228 | $425,300 | $223,100 | $202,200 |
| 2021 | $10,228 | $425,300 | $223,100 | $202,200 |
| 2020 | $10,092 | $425,300 | $223,100 | $202,200 |
| 2019 | $10,046 | $425,300 | $223,100 | $202,200 |
| 2018 | $9,956 | $425,300 | $223,100 | $202,200 |
| 2017 | $9,918 | $425,300 | $223,100 | $202,200 |
| 2016 | $9,867 | $425,300 | $223,100 | $202,200 |
| 2015 | $9,744 | $425,300 | $223,100 | $202,200 |
| 2014 | $9,761 | $425,300 | $223,100 | $202,200 |
Source: Public Records
Map
Nearby Homes
Your Personal Tour Guide
Ask me questions while you tour the home.