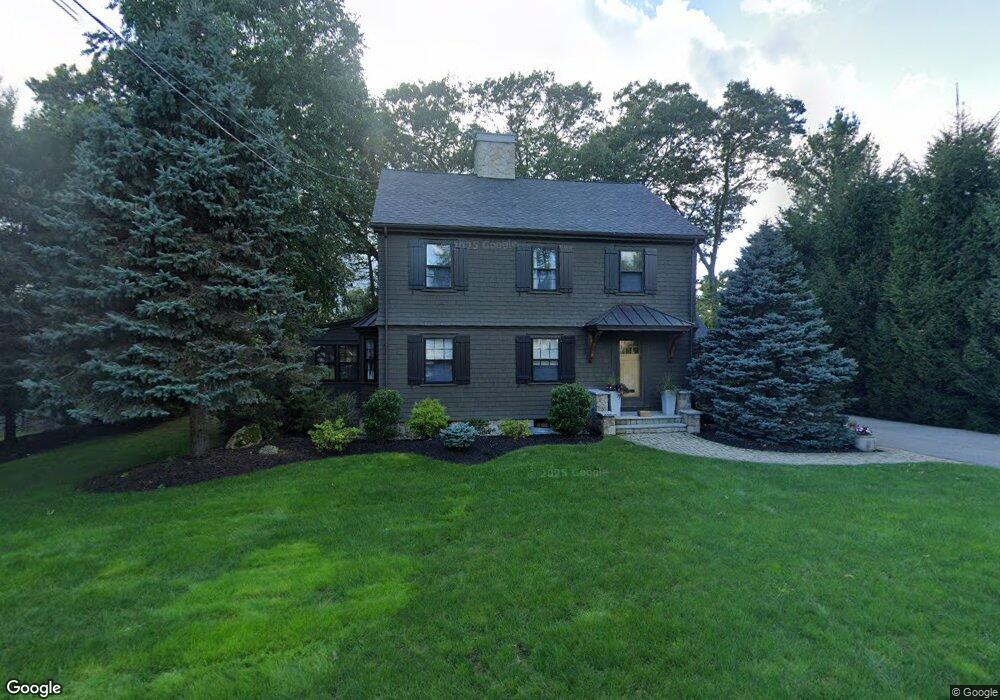
12 Cedar Rd Andover, MA 01810
Shawsheen Heights NeighborhoodEstimated Value: $1,078,210 - $1,320,000
3
Beds
3
Baths
2,136
Sq Ft
$566/Sq Ft
Est. Value
About This Home
This home is located at 12 Cedar Rd, Andover, MA 01810 and is currently estimated at $1,209,553, approximately $566 per square foot. 12 Cedar Rd is a home located in Essex County with nearby schools including West Elementary School, Doherty Middle School, and Andover High School.
Ownership History
Date
Name
Owned For
Owner Type
Purchase Details
Closed on
Jun 22, 2016
Sold by
Obrien Joan E
Bought by
Hamby David W and Hamby Jennifer A
Current Estimated Value
Home Financials for this Owner
Home Financials are based on the most recent Mortgage that was taken out on this home.
Original Mortgage
$560,000
Outstanding Balance
$444,487
Interest Rate
3.57%
Mortgage Type
Purchase Money Mortgage
Estimated Equity
$765,066
Purchase Details
Closed on
Oct 31, 2005
Sold by
Clancy Christine
Bought by
Obrien Joan E
Purchase Details
Closed on
Nov 12, 2004
Sold by
Marino Richard T
Bought by
Clancy Christine
Home Financials for this Owner
Home Financials are based on the most recent Mortgage that was taken out on this home.
Original Mortgage
$330,000
Interest Rate
5.75%
Mortgage Type
Purchase Money Mortgage
Purchase Details
Closed on
Nov 24, 2003
Sold by
Earley Stephen P
Bought by
Marino Richard T
Purchase Details
Closed on
Jun 15, 2000
Sold by
Earley William J
Bought by
Earley Stephen P
Create a Home Valuation Report for This Property
The Home Valuation Report is an in-depth analysis detailing your home's value as well as a comparison with similar homes in the area
Home Values in the Area
Average Home Value in this Area
Purchase History
| Date | Buyer | Sale Price | Title Company |
|---|---|---|---|
| Hamby David W | $700,000 | -- | |
| Obrien Joan E | $625,000 | -- | |
| Obrien Joan E | $625,000 | -- | |
| Clancy Christine | $600,000 | -- | |
| Clancy Christine | $600,000 | -- | |
| Marino Richard T | $575,000 | -- | |
| Marino Richard T | $575,000 | -- | |
| Earley Stephen P | $410,000 | -- | |
| Earley Stephen P | $410,000 | -- |
Source: Public Records
Mortgage History
| Date | Status | Borrower | Loan Amount |
|---|---|---|---|
| Open | Hamby David W | $560,000 | |
| Closed | Earley Stephen P | $560,000 | |
| Previous Owner | Clancy Christine | $330,000 | |
| Previous Owner | Earley Stephen P | $100,000 |
Source: Public Records
Tax History
| Year | Tax Paid | Tax Assessment Tax Assessment Total Assessment is a certain percentage of the fair market value that is determined by local assessors to be the total taxable value of land and additions on the property. | Land | Improvement |
|---|---|---|---|---|
| 2024 | $12,447 | $966,400 | $581,500 | $384,900 |
| 2023 | $11,914 | $872,200 | $523,900 | $348,300 |
| 2022 | $11,182 | $765,900 | $455,400 | $310,500 |
| 2021 | $10,683 | $698,700 | $413,900 | $284,800 |
| 2020 | $10,262 | $683,700 | $403,800 | $279,900 |
| 2019 | $10,173 | $666,200 | $392,000 | $274,200 |
| 2018 | $9,847 | $629,600 | $376,800 | $252,800 |
| 2017 | $9,415 | $620,200 | $369,400 | $250,800 |
| 2016 | $9,191 | $620,200 | $369,400 | $250,800 |
| 2015 | $9,204 | $614,800 | $377,800 | $237,000 |
Source: Public Records
Map
Nearby Homes
- 62 Carmel Rd
- 36 High St
- 1 Sweeney Ct
- 2 Powder Mill Square Unit 2B
- 46 Whittier St
- 1 Stratford Rd
- 70 Washington Park Dr Unit 6
- 40C Washington Park Dr Unit 12
- 81 Chestnut St Unit 81
- 33 Chestnut St Unit 2
- 181 High St Unit 1
- 96 N Main St Unit 3
- 100.5 Main St Unit Q
- 1 Longwood Dr Unit 5 (109)
- 11 Cuba St
- 17 Carisbrooke St
- 16 Balmoral St Unit 214
- 170 Haverhill St Unit 138
- 154 Main St
- 42 York St
Your Personal Tour Guide
Ask me questions while you tour the home.