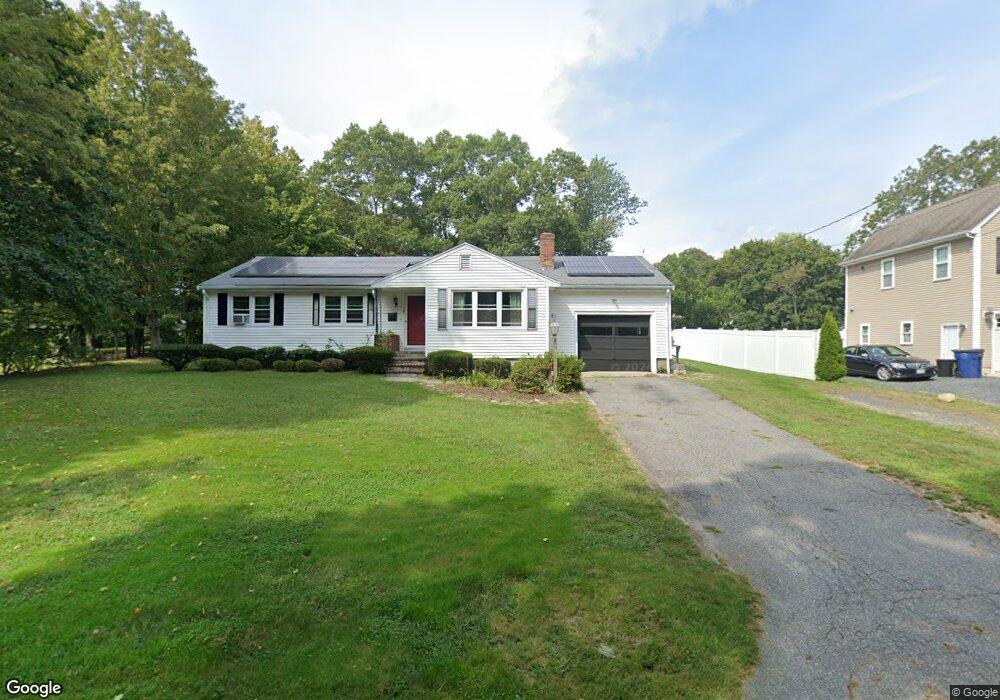
12 Charles St Medway, MA 02053
Estimated Value: $475,000 - $575,413
3
Beds
3
Baths
2,002
Sq Ft
$267/Sq Ft
Est. Value
About This Home
This home is located at 12 Charles St, Medway, MA 02053 and is currently estimated at $533,603, approximately $266 per square foot. 12 Charles St is a home located in Norfolk County with nearby schools including John D. McGovern Elementary School, Burke-Memorial Elementary, and Medway Middle School.
Ownership History
Date
Name
Owned For
Owner Type
Purchase Details
Closed on
Mar 2, 2007
Sold by
Bcm Ft and Cook Kathleen A
Bought by
Mollung Rosemary and Mollung Tom S
Current Estimated Value
Home Financials for this Owner
Home Financials are based on the most recent Mortgage that was taken out on this home.
Original Mortgage
$229,000
Outstanding Balance
$138,686
Interest Rate
6.27%
Mortgage Type
Purchase Money Mortgage
Estimated Equity
$394,917
Create a Home Valuation Report for This Property
The Home Valuation Report is an in-depth analysis detailing your home's value as well as a comparison with similar homes in the area
Home Values in the Area
Average Home Value in this Area
Purchase History
| Date | Buyer | Sale Price | Title Company |
|---|---|---|---|
| Mollung Rosemary | $216,666 | -- |
Source: Public Records
Mortgage History
| Date | Status | Borrower | Loan Amount |
|---|---|---|---|
| Open | Mollung Rosemary | $229,000 |
Source: Public Records
Tax History Compared to Growth
Tax History
| Year | Tax Paid | Tax Assessment Tax Assessment Total Assessment is a certain percentage of the fair market value that is determined by local assessors to be the total taxable value of land and additions on the property. | Land | Improvement |
|---|---|---|---|---|
| 2025 | $6,539 | $458,900 | $285,400 | $173,500 |
| 2024 | $6,608 | $458,900 | $285,400 | $173,500 |
| 2023 | $6,115 | $383,600 | $236,500 | $147,100 |
| 2022 | $6,025 | $355,900 | $210,000 | $145,900 |
| 2021 | $5,722 | $327,700 | $193,700 | $134,000 |
| 2020 | $5,485 | $313,400 | $179,400 | $134,000 |
| 2019 | $5,257 | $309,800 | $179,400 | $130,400 |
| 2018 | $5,038 | $285,300 | $154,900 | $130,400 |
| 2017 | $5,005 | $279,300 | $154,900 | $124,400 |
| 2016 | $4,555 | $251,500 | $127,600 | $123,900 |
| 2015 | $4,544 | $249,100 | $120,300 | $128,800 |
| 2014 | $4,490 | $238,300 | $126,400 | $111,900 |
Source: Public Records
Map
Nearby Homes
- 28 Wellington St
- 21 Riverside Rd
- 4 Shaw St
- 280 Village St Unit D2
- 176 Main St Unit 3
- 220 Main St Unit 220
- 5 Fales St
- 6 Freedom Trail
- 18 Mary Anne Dr
- 951 Pond St
- 0 Elm St
- 22 Sunset Dr
- 14 Heritage Dr
- 462 Hartford Ave
- 455 Hartford Ave
- 39 West St
- 7 Gloucester Dr
- 14 Hawthorne Village Unit D
- 36 Lovering St
- 0 Old Log Lane (Farm St) Unit 73416329
- 14 Charles St
- 10 Charles St
- 7A Charles St
- 8 Charles St
- 13 Charles St
- 6 Charles St
- 6 Charles St Unit LANE
- 6 Charles St Unit 6
- 11 Charles St
- 4 Charles St
- 4 Charles St Unit LANE
- 0 Charles St
- 9 Charles St
- 3 Haven St
- 15 Charles St
- 8 Haven St
- 8 Haven St Unit 8B Second Floor
- 12 Campbell St
- 6 Haven St
- 5 Charles St