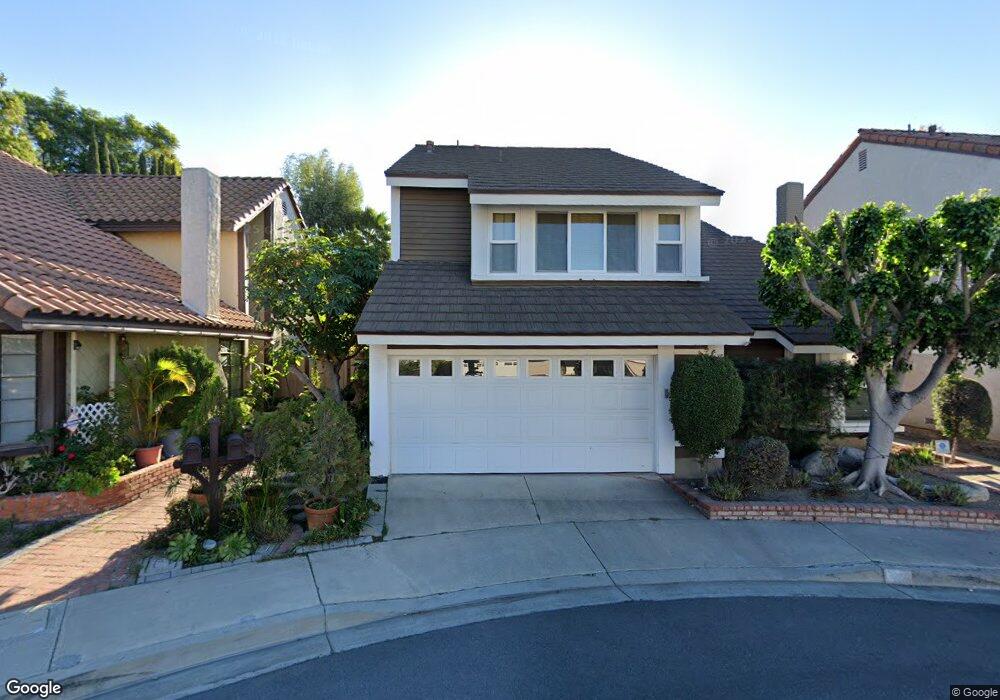
12 Chattanooga Irvine, CA 92620
Northwood NeighborhoodEstimated Value: $1,553,743 - $1,809,000
4
Beds
3
Baths
2,092
Sq Ft
$823/Sq Ft
Est. Value
About This Home
This home is located at 12 Chattanooga, Irvine, CA 92620 and is currently estimated at $1,721,186, approximately $822 per square foot. 12 Chattanooga is a home located in Orange County with nearby schools including Brywood Elementary School, Sierra Vista Middle School, and Northwood High School.
Ownership History
Date
Name
Owned For
Owner Type
Purchase Details
Closed on
Nov 1, 2019
Sold by
Kong Jacob Kim and Yu Wai Ming
Bought by
Kong Jacob Kim and Yu Wai Ming
Current Estimated Value
Purchase Details
Closed on
Jul 21, 2010
Sold by
Klappenback Kip Allen and Klappenback Dianna Lee
Bought by
Kong Jacob and Yu Wai Ming
Home Financials for this Owner
Home Financials are based on the most recent Mortgage that was taken out on this home.
Original Mortgage
$508,000
Outstanding Balance
$334,010
Interest Rate
4.51%
Mortgage Type
New Conventional
Estimated Equity
$1,387,176
Create a Home Valuation Report for This Property
The Home Valuation Report is an in-depth analysis detailing your home's value as well as a comparison with similar homes in the area
Home Values in the Area
Average Home Value in this Area
Purchase History
| Date | Buyer | Sale Price | Title Company |
|---|---|---|---|
| Kong Jacob Kim | -- | None Available | |
| Kong Jacob Kim | -- | None Available | |
| Kong Jacob | $635,000 | Stewart Title Irvine |
Source: Public Records
Mortgage History
| Date | Status | Borrower | Loan Amount |
|---|---|---|---|
| Open | Kong Jacob | $508,000 |
Source: Public Records
Tax History
| Year | Tax Paid | Tax Assessment Tax Assessment Total Assessment is a certain percentage of the fair market value that is determined by local assessors to be the total taxable value of land and additions on the property. | Land | Improvement |
|---|---|---|---|---|
| 2025 | $8,400 | $813,540 | $619,986 | $193,554 |
| 2024 | $8,400 | $797,589 | $607,830 | $189,759 |
| 2023 | $8,182 | $781,950 | $595,911 | $186,039 |
| 2022 | $8,026 | $766,618 | $584,226 | $182,392 |
| 2021 | $7,841 | $751,587 | $572,771 | $178,816 |
| 2020 | $7,797 | $743,881 | $566,898 | $176,983 |
| 2019 | $7,623 | $729,296 | $555,783 | $173,513 |
| 2018 | $7,488 | $714,997 | $544,886 | $170,111 |
| 2017 | $7,333 | $700,978 | $534,202 | $166,776 |
| 2016 | $7,006 | $687,234 | $523,728 | $163,506 |
| 2015 | $6,901 | $676,912 | $515,862 | $161,050 |
| 2014 | $6,766 | $663,653 | $505,757 | $157,896 |
Source: Public Records
Map
Nearby Homes
Your Personal Tour Guide
Ask me questions while you tour the home.