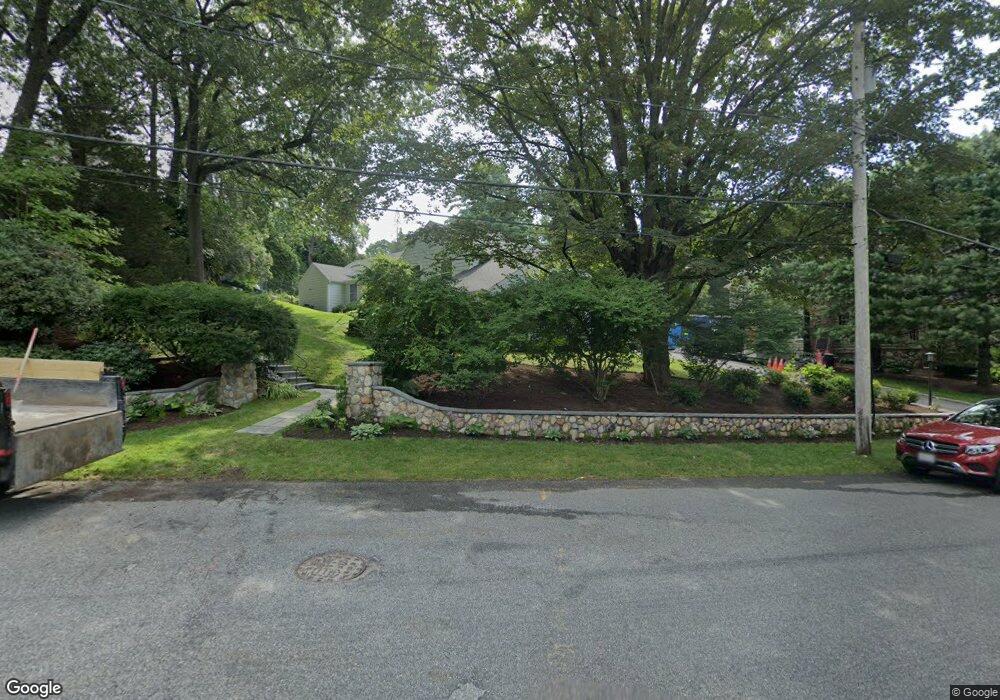
12 Clovelly Rd Wellesley Hills, MA 02481
Wellesley Hills NeighborhoodEstimated Value: $2,277,877 - $2,620,000
3
Beds
3
Baths
2,662
Sq Ft
$906/Sq Ft
Est. Value
About This Home
This home is located at 12 Clovelly Rd, Wellesley Hills, MA 02481 and is currently estimated at $2,412,719, approximately $906 per square foot. 12 Clovelly Rd is a home located in Norfolk County with nearby schools including Joseph E. Fiske Elementary School, Wellesley Middle School, and Wellesley Sr High School.
Ownership History
Date
Name
Owned For
Owner Type
Purchase Details
Closed on
May 16, 2019
Sold by
Lois P Smiley 1993 T
Bought by
Jones Douglas L and Drachman Virginia G
Current Estimated Value
Home Financials for this Owner
Home Financials are based on the most recent Mortgage that was taken out on this home.
Original Mortgage
$1,300,000
Outstanding Balance
$1,138,296
Interest Rate
4%
Mortgage Type
New Conventional
Estimated Equity
$1,274,423
Purchase Details
Closed on
Nov 23, 2011
Sold by
Smiley Lois P
Bought by
Lois P Smiley 1993 T
Purchase Details
Closed on
Dec 21, 1990
Sold by
Cronin Extr Philip J
Bought by
Smiley Lois P
Home Financials for this Owner
Home Financials are based on the most recent Mortgage that was taken out on this home.
Original Mortgage
$150,000
Interest Rate
10.02%
Mortgage Type
Purchase Money Mortgage
Create a Home Valuation Report for This Property
The Home Valuation Report is an in-depth analysis detailing your home's value as well as a comparison with similar homes in the area
Home Values in the Area
Average Home Value in this Area
Purchase History
| Date | Buyer | Sale Price | Title Company |
|---|---|---|---|
| Jones Douglas L | $1,300,000 | -- | |
| Lois P Smiley 1993 T | -- | -- | |
| Smiley Lois P | $325,000 | -- |
Source: Public Records
Mortgage History
| Date | Status | Borrower | Loan Amount |
|---|---|---|---|
| Open | Jones Douglas L | $1,300,000 | |
| Previous Owner | Smiley Lois P | $150,000 |
Source: Public Records
Tax History Compared to Growth
Tax History
| Year | Tax Paid | Tax Assessment Tax Assessment Total Assessment is a certain percentage of the fair market value that is determined by local assessors to be the total taxable value of land and additions on the property. | Land | Improvement |
|---|---|---|---|---|
| 2025 | $20,838 | $2,027,000 | $1,454,000 | $573,000 |
| 2024 | $20,924 | $2,010,000 | $1,454,000 | $556,000 |
| 2023 | $20,587 | $1,798,000 | $1,297,000 | $501,000 |
| 2022 | $20,218 | $1,731,000 | $1,162,000 | $569,000 |
| 2021 | $17,637 | $1,501,000 | $1,082,000 | $419,000 |
| 2020 | $14,912 | $1,290,000 | $1,082,000 | $208,000 |
| 2019 | $14,972 | $1,294,000 | $1,122,000 | $172,000 |
| 2018 | $12,775 | $1,069,000 | $890,000 | $179,000 |
| 2017 | $12,615 | $1,070,000 | $891,000 | $179,000 |
| 2016 | $12,422 | $1,050,000 | $876,000 | $174,000 |
| 2015 | $12,115 | $1,048,000 | $875,000 | $173,000 |
Source: Public Records
Map
Nearby Homes
- 28 Clovelly Rd
- 29 Rockland St
- 7 Cliff Rd
- 6 Oakland Cir
- 25 Shaw Rd
- 46 Lincoln Rd
- 26 Edmunds Rd
- 20 Oakland Street Front
- 93 Seaver St
- 42 Edmunds Rd
- 32 Twitchell St
- 94 Rice St
- 14 Twitchell St
- 54 Colburn Rd
- 12 Bird Hill Ave
- 32 Kingsbury St Unit A
- 98 Great Plain Ave
- 2 Longfellow Rd
- 17 Atwood St
- 42 Calvin Rd