J
Landlord's Agent in 2019
John McMahon
Phoenix Realty Group
(617) 731-3311
2 in this area
8 Total Sales

Estimated Value: $480,000 - $537,000
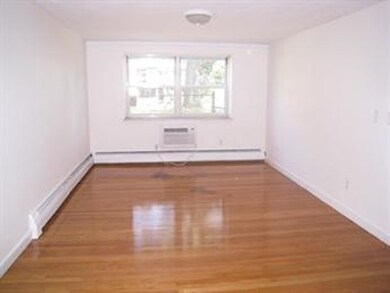
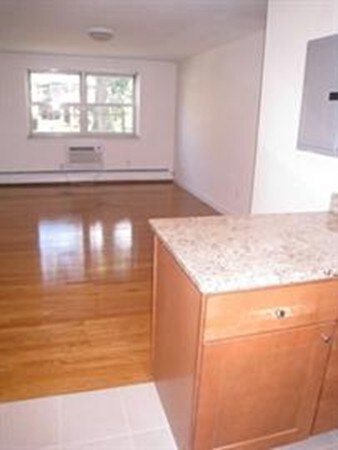
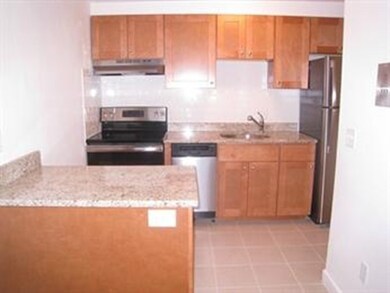
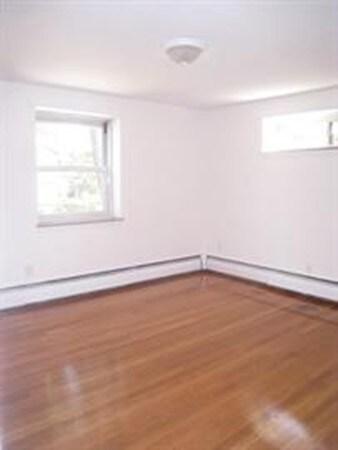
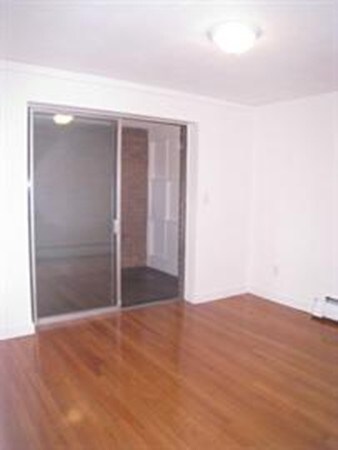
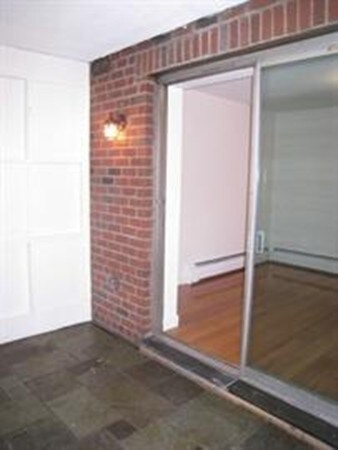
Renovated 2-bed near the T with parking available. Very attractive and well located two bedroom condo with a completely renovated kitchen with stainless steel appliances and granite counter-tops. The bathroom was completely gutted and has new ceramic tiles and fixtures. The electrical and plumbing have been updated, the hardwood floors have been refinished, and the walls and ceilings recently painted. There are new closet and unit doors. and a new in-wall air-conditioning unit. As a bonus, there is an enclosed 3-season porch that is off one of the bedrooms. There is one deeded parking space directly in front of the building available for rent. This unit is only one block to Green line and close to shops. Just a short walk to Whole Foods!
| Date | Buyer | Sale Price | Title Company |
|---|---|---|---|
| Blue Sky Ret | -- | None Available | |
| Fang-Chen Ching | $425,000 | -- |
| Date | Event | Price | List to Sale | Price per Sq Ft | Prior Sale |
|---|---|---|---|---|---|
| 03/21/2019 03/21/19 | Rented | $2,250 | 0.0% | -- | |
| 03/20/2019 03/20/19 | Under Contract | -- | -- | -- | |
| 03/12/2019 03/12/19 | For Rent | $2,250 | +2.3% | -- | |
| 08/07/2018 08/07/18 | Rented | $2,200 | +2.3% | -- | |
| 08/06/2018 08/06/18 | Under Contract | -- | -- | -- | |
| 08/03/2018 08/03/18 | For Rent | $2,150 | -6.5% | -- | |
| 04/09/2018 04/09/18 | Rented | $2,300 | +7.0% | -- | |
| 04/03/2018 04/03/18 | Under Contract | -- | -- | -- | |
| 03/05/2018 03/05/18 | For Rent | $2,150 | -4.4% | -- | |
| 05/28/2017 05/28/17 | Rented | $2,250 | +7.1% | -- | |
| 05/23/2017 05/23/17 | Under Contract | -- | -- | -- | |
| 05/02/2017 05/02/17 | For Rent | $2,100 | 0.0% | -- | |
| 10/05/2016 10/05/16 | Sold | $425,000 | 0.0% | $579 / Sq Ft | View Prior Sale |
| 09/08/2016 09/08/16 | Pending | -- | -- | -- | |
| 08/27/2016 08/27/16 | For Sale | $425,000 | -- | $579 / Sq Ft |
| Year | Tax Paid | Tax Assessment Tax Assessment Total Assessment is a certain percentage of the fair market value that is determined by local assessors to be the total taxable value of land and additions on the property. | Land | Improvement |
|---|---|---|---|---|
| 2025 | $5,088 | $439,400 | $0 | $439,400 |
| 2024 | $4,453 | $408,500 | $0 | $408,500 |
| 2023 | $4,387 | $408,500 | $0 | $408,500 |
| 2022 | $4,192 | $385,300 | $0 | $385,300 |
| 2021 | $4,073 | $381,700 | $0 | $381,700 |
| 2020 | $3,806 | $360,400 | $0 | $360,400 |
| 2019 | $3,723 | $353,200 | $0 | $353,200 |
| 2018 | $3,460 | $330,200 | $0 | $330,200 |
| 2017 | $2,693 | $254,300 | $0 | $254,300 |
| 2016 | $2,566 | $233,300 | $0 | $233,300 |
| 2015 | $2,817 | $232,600 | $0 | $232,600 |
| 2014 | $2,764 | $219,700 | $0 | $219,700 |
J
Landlord's Agent in 2019
John McMahon
Phoenix Realty Group
(617) 731-3311
2 in this area
8 Total Sales
S
Buyer's Agent in 2018
Stephen Johansen
Compass
14 Total Sales
J
Seller's Agent in 2016
Jeff Indeck
Oxford Street Realty
8 Total Sales

Buyer's Agent in 2016
I-Ru ChangChien
Move2Boston Group, LLC
(508) 904-0077
25 Total Sales
Source: MLS Property Information Network (MLS PIN)
MLS Number: 72463714
APN: BRIG-000000-000021-001776-000048
Disclaimer: Certain information contained herein is derived from information provided by parties other than Homes.com. All information provided is deemed reliable, but is not guaranteed to be accurate and should be independently verified.
![]() The property listing data and information, or the Images, set forth herein were provided to MLS Property Information Network, Inc. from third party sources, including sellers, lessors and public records, and were compiled by MLS Property Information Network, Inc. The property listing data and information, and the Images, are for the personal, non-commercial use of consumers having a good faith interest in purchasing or leasing listed properties of the type displayed to them and may not be used for any purpose other than to identify prospective properties which such consumers may have a good faith interest in purchasing or leasing. MLS Property Information Network, Inc. and its subscribers disclaim any and all representations and warranties as to the accuracy of the property listing data and information, or as to the accuracy of any of the Images, set forth herein.
The property listing data and information, or the Images, set forth herein were provided to MLS Property Information Network, Inc. from third party sources, including sellers, lessors and public records, and were compiled by MLS Property Information Network, Inc. The property listing data and information, and the Images, are for the personal, non-commercial use of consumers having a good faith interest in purchasing or leasing listed properties of the type displayed to them and may not be used for any purpose other than to identify prospective properties which such consumers may have a good faith interest in purchasing or leasing. MLS Property Information Network, Inc. and its subscribers disclaim any and all representations and warranties as to the accuracy of the property listing data and information, or as to the accuracy of any of the Images, set forth herein.