Estimated Value: $2,037,699 - $2,283,000
3
Beds
3
Baths
2,944
Sq Ft
$746/Sq Ft
Est. Value
About This Home
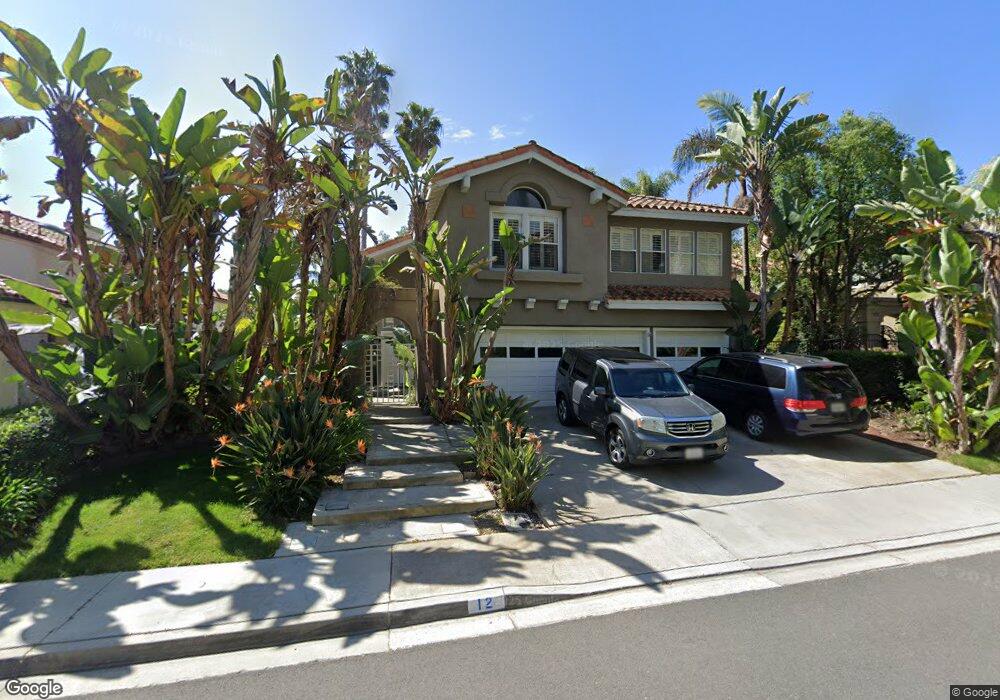
This home is located at 12 Corfu, Laguna Niguel, CA 92677 and is currently estimated at $2,195,175, approximately $745 per square foot. 12 Corfu is a home located in Orange County with nearby schools including George White Elementary, Niguel Hills Middle School, and Dana Hills High School.
Ownership History
Date
Name
Owned For
Owner Type
Purchase Details
Closed on
Oct 14, 2003
Sold by
Sesar Ayoub
Bought by
Harkey John Anthony and Harkey Mina M
Current Estimated Value
Home Financials for this Owner
Home Financials are based on the most recent Mortgage that was taken out on this home.
Original Mortgage
$635,000
Outstanding Balance
$266,384
Interest Rate
4.75%
Mortgage Type
Purchase Money Mortgage
Estimated Equity
$1,928,791
Purchase Details
Closed on
Dec 26, 2001
Sold by
Lin Pei Chun
Bought by
Sesar Ayoub
Home Financials for this Owner
Home Financials are based on the most recent Mortgage that was taken out on this home.
Original Mortgage
$528,000
Interest Rate
6.25%
Purchase Details
Closed on
Dec 20, 1996
Sold by
Chun Lin Pei
Bought by
Sesar Ayoub and Lin Pei Chun
Home Financials for this Owner
Home Financials are based on the most recent Mortgage that was taken out on this home.
Original Mortgage
$300,000
Interest Rate
7.12%
Create a Home Valuation Report for This Property
The Home Valuation Report is an in-depth analysis detailing your home's value as well as a comparison with similar homes in the area
Home Values in the Area
Average Home Value in this Area
Purchase History
| Date | Buyer | Sale Price | Title Company |
|---|---|---|---|
| Harkey John Anthony | $875,000 | Ticor Title | |
| Sesar Ayoub | -- | First American Title Co | |
| Sesar Ayoub | -- | Continental Lawyers Title Co |
Source: Public Records
Mortgage History
| Date | Status | Borrower | Loan Amount |
|---|---|---|---|
| Open | Harkey John Anthony | $635,000 | |
| Previous Owner | Sesar Ayoub | $528,000 | |
| Previous Owner | Sesar Ayoub | $300,000 |
Source: Public Records
Tax History
| Year | Tax Paid | Tax Assessment Tax Assessment Total Assessment is a certain percentage of the fair market value that is determined by local assessors to be the total taxable value of land and additions on the property. | Land | Improvement |
|---|---|---|---|---|
| 2025 | $12,286 | $1,244,063 | $861,345 | $382,718 |
| 2024 | $12,286 | $1,219,670 | $844,456 | $375,214 |
| 2023 | $12,025 | $1,195,755 | $827,898 | $367,857 |
| 2022 | $11,795 | $1,172,309 | $811,664 | $360,645 |
| 2021 | $11,566 | $1,149,323 | $795,749 | $353,574 |
| 2020 | $11,450 | $1,137,539 | $787,590 | $349,949 |
| 2019 | $11,223 | $1,115,235 | $772,147 | $343,088 |
| 2018 | $11,007 | $1,093,368 | $757,007 | $336,361 |
| 2017 | $10,790 | $1,071,930 | $742,164 | $329,766 |
| 2016 | $10,582 | $1,050,912 | $727,612 | $323,300 |
| 2015 | $10,422 | $1,035,127 | $716,683 | $318,444 |
| 2014 | $9,889 | $982,000 | $690,626 | $291,374 |
Source: Public Records
Map
Nearby Homes
Your Personal Tour Guide
Ask me questions while you tour the home.