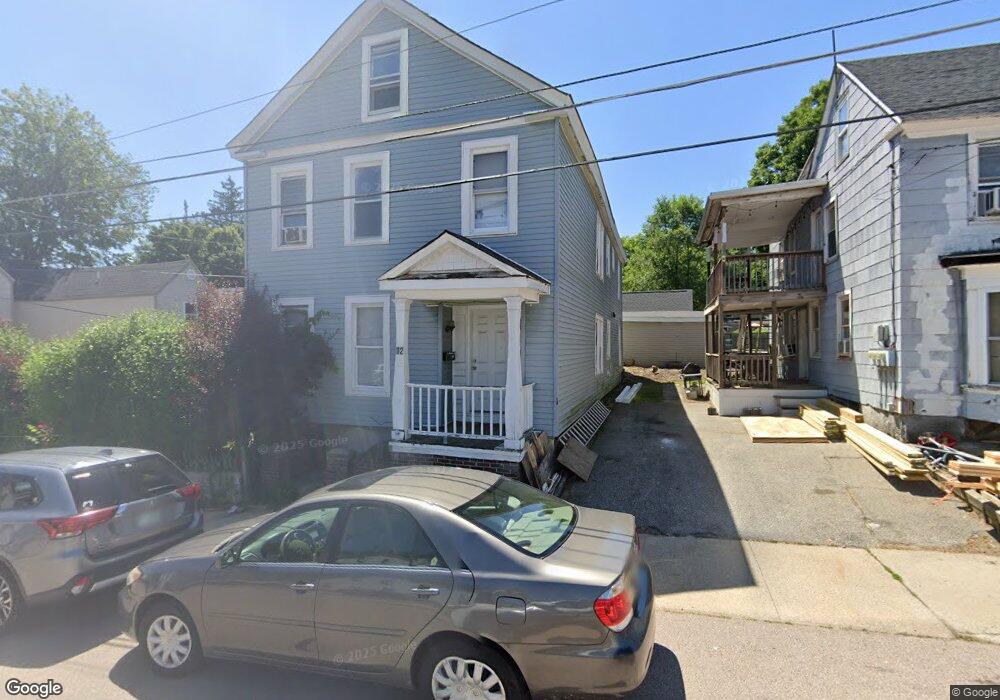
12 Cross St Nashua, NH 03064
North End Nashua NeighborhoodEstimated Value: $473,961 - $571,000
4
Beds
2
Baths
2,414
Sq Ft
$212/Sq Ft
Est. Value
About This Home
This home is located at 12 Cross St, Nashua, NH 03064 and is currently estimated at $511,990, approximately $212 per square foot. 12 Cross St is a home located in Hillsborough County with nearby schools including Mount Pleasant Elementary School, Pennichuck Middle School, and Nashua High School North.
Ownership History
Date
Name
Owned For
Owner Type
Purchase Details
Closed on
May 7, 2012
Sold by
Martinez Maribel and Martinez Octavio
Bought by
Martinez Maribel
Current Estimated Value
Purchase Details
Closed on
Aug 30, 2000
Sold by
Philbrick Wesley and Philbrick Nelsa
Bought by
Martinez Octavio and Martinez Maribel
Home Financials for this Owner
Home Financials are based on the most recent Mortgage that was taken out on this home.
Original Mortgage
$134,830
Interest Rate
8.16%
Mortgage Type
Purchase Money Mortgage
Create a Home Valuation Report for This Property
The Home Valuation Report is an in-depth analysis detailing your home's value as well as a comparison with similar homes in the area
Home Values in the Area
Average Home Value in this Area
Purchase History
| Date | Buyer | Sale Price | Title Company |
|---|---|---|---|
| Martinez Maribel | -- | -- | |
| Martinez Maribel | -- | -- | |
| Martinez Octavio | $134,900 | -- |
Source: Public Records
Mortgage History
| Date | Status | Borrower | Loan Amount |
|---|---|---|---|
| Previous Owner | Martinez Octavio | $134,830 |
Source: Public Records
Tax History Compared to Growth
Tax History
| Year | Tax Paid | Tax Assessment Tax Assessment Total Assessment is a certain percentage of the fair market value that is determined by local assessors to be the total taxable value of land and additions on the property. | Land | Improvement |
|---|---|---|---|---|
| 2024 | $7,406 | $465,800 | $103,800 | $362,000 |
| 2023 | $6,902 | $378,600 | $83,100 | $295,500 |
| 2022 | $6,841 | $378,600 | $83,100 | $295,500 |
| 2021 | $5,573 | $240,000 | $52,600 | $187,400 |
| 2020 | $5,411 | $239,300 | $52,600 | $186,700 |
| 2019 | $5,207 | $239,300 | $52,600 | $186,700 |
| 2018 | $5,076 | $239,300 | $52,600 | $186,700 |
| 2017 | $5,101 | $197,800 | $59,700 | $138,100 |
| 2016 | $4,959 | $197,800 | $59,700 | $138,100 |
| 2015 | $4,852 | $197,800 | $59,700 | $138,100 |
| 2014 | $4,757 | $197,800 | $59,700 | $138,100 |
Source: Public Records
Map
Nearby Homes