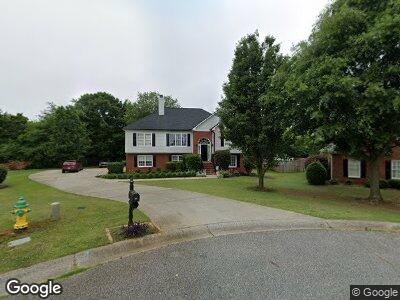
12 Cumberland Gap NW Cartersville, GA 30120
Estimated Value: $366,077 - $386,000
3
Beds
2
Baths
1,620
Sq Ft
$232/Sq Ft
Est. Value
About This Home
This home is located at 12 Cumberland Gap NW, Cartersville, GA 30120 and is currently estimated at $376,269, approximately $232 per square foot. 12 Cumberland Gap NW is a home located in Bartow County with nearby schools including Hamilton Crossing Elementary School, Cass Middle School, and Cass High School.
Create a Home Valuation Report for This Property
The Home Valuation Report is an in-depth analysis detailing your home's value as well as a comparison with similar homes in the area
Home Values in the Area
Average Home Value in this Area
Mortgage History
| Date | Status | Borrower | Loan Amount |
|---|---|---|---|
| Closed | Smith Jon A | $50,000 | |
| Closed | Smith Jon A | $207,000 | |
| Closed | Smith Jon A | $210,143 | |
| Closed | Smith Jon A | $213,750 | |
| Closed | Smith Jon A | $205,000 |
Source: Public Records
Tax History Compared to Growth
Tax History
| Year | Tax Paid | Tax Assessment Tax Assessment Total Assessment is a certain percentage of the fair market value that is determined by local assessors to be the total taxable value of land and additions on the property. | Land | Improvement |
|---|---|---|---|---|
| 2024 | $3,337 | $143,733 | $32,000 | $111,733 |
| 2023 | $3,337 | $138,716 | $32,000 | $106,716 |
| 2022 | $2,659 | $111,282 | $16,000 | $95,282 |
| 2021 | $2,236 | $90,440 | $16,000 | $74,440 |
| 2020 | $2,292 | $88,440 | $14,000 | $74,440 |
| 2019 | $2,177 | $83,421 | $14,000 | $69,421 |
| 2018 | $2,086 | $79,864 | $12,000 | $67,864 |
| 2017 | $2,096 | $79,864 | $12,000 | $67,864 |
| 2016 | $1,907 | $72,600 | $12,000 | $60,600 |
| 2015 | $1,835 | $69,920 | $12,000 | $57,920 |
| 2014 | $1,825 | $67,520 | $16,000 | $51,520 |
| 2013 | -- | $59,480 | $12,000 | $47,480 |
Source: Public Records
Map
Nearby Homes
- 12 Cumberland Gap NW
- 35 Berkshire Dr NW
- 13 Cumberland Gap NW
- 11 Cumberland Gap NW
- 37 Berkshire Dr NW
- 37 Berkshire Dr NW
- 31 Berkshire Dr NW
- 31 Berkshire Dr NW Unit 30120-7767
- 38 Berkshire Dr NW
- 34 Berkshire Dr NW
- 36 Berkshire Dr NW
- 32 Berkshire Dr NW
- 30 Berkshire Dr NW
- 17 Claire Cove NW
- 18 Claire Cove NW
- 29 Berkshire Dr NW
- 13 Gunston Hall NW
- 28 Berkshire Dr NW
- 15 Claire Cove NW
- 0 Gunston Hall