Estimated Value: $920,000 - $1,461,000
4
Beds
4
Baths
3,293
Sq Ft
$363/Sq Ft
Est. Value
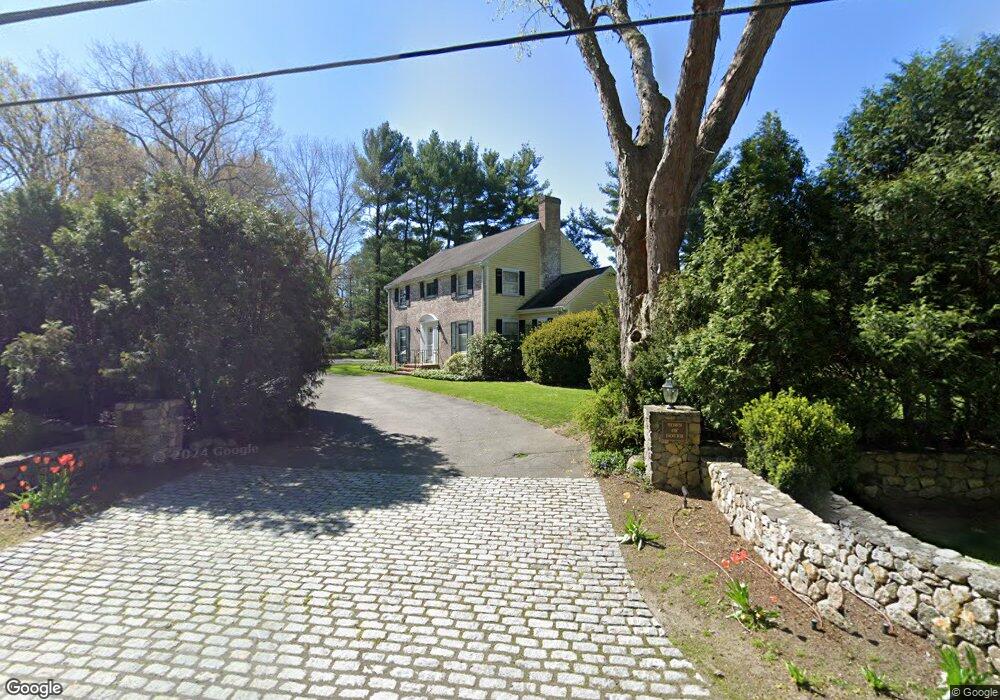
About This Home
This home is located at 12 Dover Rd, Dover, MA 02030 and is currently estimated at $1,194,599, approximately $362 per square foot. 12 Dover Rd is a home located in Norfolk County with nearby schools including Chickering Elementary School, Dover-Sherborn Regional Middle School, and Dover-Sherborn Regional High School.
Ownership History
Date
Name
Owned For
Owner Type
Purchase Details
Closed on
Sep 22, 2014
Sold by
Barclay Suzanne W
Bought by
J B Barclay Ret and Barclay
Current Estimated Value
Create a Home Valuation Report for This Property
The Home Valuation Report is an in-depth analysis detailing your home's value as well as a comparison with similar homes in the area
Home Values in the Area
Average Home Value in this Area
Purchase History
| Date | Buyer | Sale Price | Title Company |
|---|---|---|---|
| J B Barclay Ret | -- | -- |
Source: Public Records
Tax History
| Year | Tax Paid | Tax Assessment Tax Assessment Total Assessment is a certain percentage of the fair market value that is determined by local assessors to be the total taxable value of land and additions on the property. | Land | Improvement |
|---|---|---|---|---|
| 2025 | $11,654 | $1,034,100 | $660,100 | $374,000 |
| 2024 | $11,067 | $1,009,800 | $660,100 | $349,700 |
| 2023 | $10,026 | $822,500 | $519,500 | $303,000 |
| 2022 | $9,762 | $786,000 | $519,500 | $266,500 |
| 2021 | $10,007 | $776,300 | $519,500 | $256,800 |
| 2020 | $9,968 | $776,300 | $519,500 | $256,800 |
| 2019 | $10,038 | $776,300 | $519,500 | $256,800 |
| 2018 | $8,557 | $666,400 | $424,200 | $242,200 |
| 2017 | $8,622 | $660,700 | $411,200 | $249,500 |
| 2016 | $8,510 | $660,700 | $411,200 | $249,500 |
| 2015 | $8,435 | $664,200 | $411,200 | $253,000 |
Source: Public Records
Map
Nearby Homes
- 9 Buttercup Ln
- 8 Warren Rd
- 84 Pleasant St
- 182 Winding River Rd
- 29 Water St
- 12 Winding River Cir
- 22 Lincoln St S
- 68 Locust Ln
- 121 Livingston Rd
- 17 Eliot St
- 83 Eliot St
- 42 Troutbrook Rd
- 389 Grove St
- 3 Parsons Way
- 104 Glen St
- 18 Phillips Pond Rd
- 104 Eliot St
- 25 Longmeadow Rd
- 2 Phillips Pond Rd
- 22 Main St
Your Personal Tour Guide
Ask me questions while you tour the home.