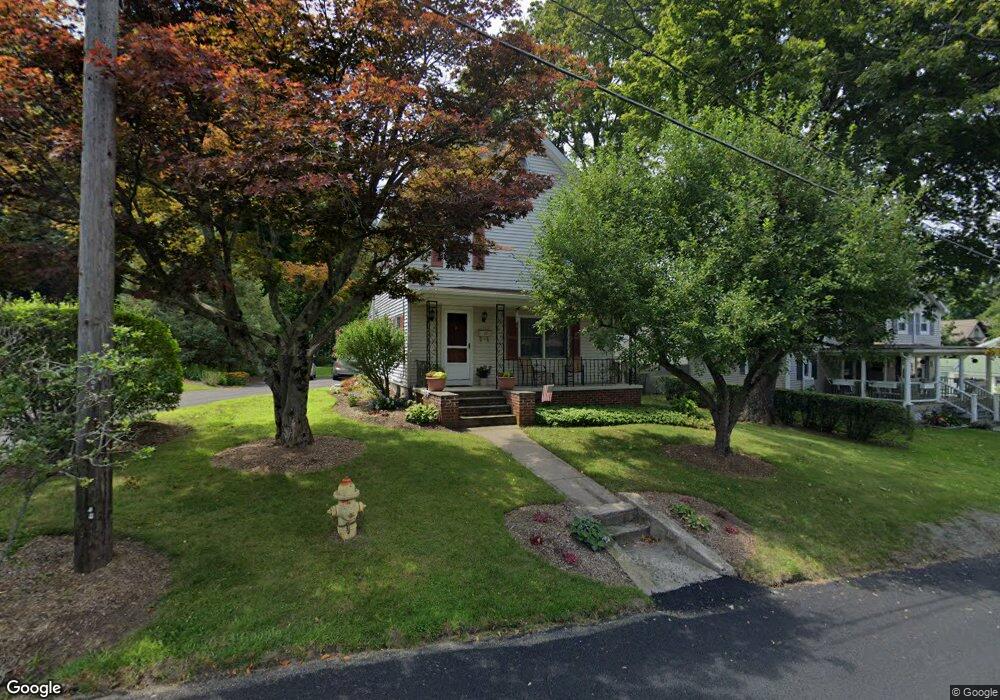
12 Durbin St Danbury, CT 06810
Estimated Value: $366,498 - $407,000
2
Beds
2
Baths
1,104
Sq Ft
$344/Sq Ft
Est. Value
About This Home
This home is located at 12 Durbin St, Danbury, CT 06810 and is currently estimated at $379,375, approximately $343 per square foot. 12 Durbin St is a home located in Fairfield County with nearby schools including Morris Street Elementary School, Rogers Park Middle School, and Danbury High School.
Ownership History
Date
Name
Owned For
Owner Type
Purchase Details
Closed on
Mar 28, 2003
Sold by
Goncalves Marcoss and Goncalves Gina
Bought by
Neville Joyce
Current Estimated Value
Home Financials for this Owner
Home Financials are based on the most recent Mortgage that was taken out on this home.
Original Mortgage
$180,800
Interest Rate
5.91%
Purchase Details
Closed on
May 27, 1998
Sold by
Boughton Mark D
Bought by
Goncalves Marcos and Goncalves Gina
Home Financials for this Owner
Home Financials are based on the most recent Mortgage that was taken out on this home.
Original Mortgage
$124,500
Interest Rate
7.12%
Mortgage Type
Unknown
Purchase Details
Closed on
Mar 29, 1995
Sold by
Demo Joseph
Bought by
Boughton Mark
Create a Home Valuation Report for This Property
The Home Valuation Report is an in-depth analysis detailing your home's value as well as a comparison with similar homes in the area
Home Values in the Area
Average Home Value in this Area
Purchase History
| Date | Buyer | Sale Price | Title Company |
|---|---|---|---|
| Neville Joyce | $226,000 | -- | |
| Goncalves Marcos | $123,000 | -- | |
| Boughton Mark | $105,000 | -- |
Source: Public Records
Mortgage History
| Date | Status | Borrower | Loan Amount |
|---|---|---|---|
| Open | Boughton Mark | $152,650 | |
| Closed | Boughton Mark | $180,800 | |
| Previous Owner | Boughton Mark | $124,500 | |
| Previous Owner | Boughton Mark | $94,000 |
Source: Public Records
Tax History Compared to Growth
Tax History
| Year | Tax Paid | Tax Assessment Tax Assessment Total Assessment is a certain percentage of the fair market value that is determined by local assessors to be the total taxable value of land and additions on the property. | Land | Improvement |
|---|---|---|---|---|
| 2025 | $4,106 | $164,290 | $62,090 | $102,200 |
| 2024 | $4,015 | $164,290 | $62,090 | $102,200 |
| 2023 | $3,833 | $164,290 | $62,090 | $102,200 |
| 2022 | $3,505 | $124,200 | $66,600 | $57,600 |
| 2021 | $3,428 | $124,200 | $66,600 | $57,600 |
| 2020 | $3,428 | $124,200 | $66,600 | $57,600 |
| 2019 | $3,428 | $124,200 | $66,600 | $57,600 |
| 2018 | $3,428 | $124,200 | $66,600 | $57,600 |
| 2017 | $3,208 | $110,800 | $63,400 | $47,400 |
| 2016 | $3,178 | $110,800 | $63,400 | $47,400 |
| 2015 | $3,131 | $110,800 | $63,400 | $47,400 |
| 2014 | $3,058 | $110,800 | $63,400 | $47,400 |
Source: Public Records
Map
Nearby Homes