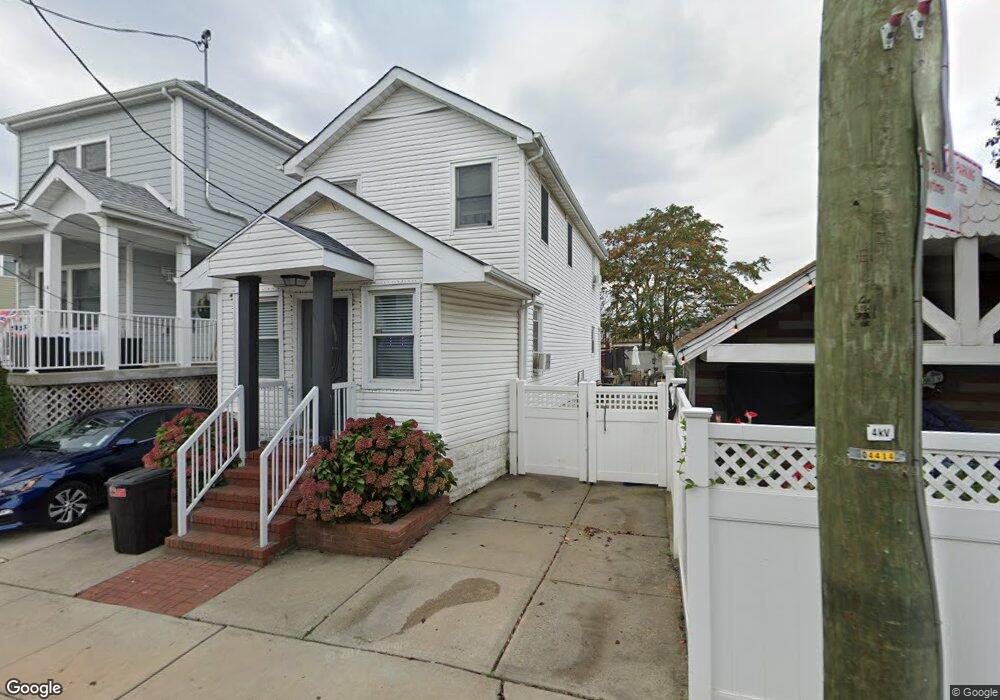
12 E 8th Rd Broad Channel, NY 11693
Broad Channel NeighborhoodEstimated Value: $575,025 - $624,000
Studio
--
Bath
1,363
Sq Ft
$439/Sq Ft
Est. Value
About This Home
This home is located at 12 E 8th Rd, Broad Channel, NY 11693 and is currently estimated at $598,506, approximately $439 per square foot. 12 E 8th Rd is a home located in Queens County with nearby schools including P.S. 47 - Chris Galas and St Rose of Lima Catholic Academy.
Ownership History
Date
Name
Owned For
Owner Type
Purchase Details
Closed on
Aug 20, 2014
Sold by
Gribbin Michael and Gribbin Jennifer
Bought by
Gribbin Jennifer and Gribbin Michael
Current Estimated Value
Home Financials for this Owner
Home Financials are based on the most recent Mortgage that was taken out on this home.
Original Mortgage
$195,500
Outstanding Balance
$148,253
Interest Rate
4.12%
Mortgage Type
New Conventional
Estimated Equity
$450,253
Purchase Details
Closed on
Aug 17, 1998
Sold by
Obrien Geraldine
Bought by
Gribbin Michael
Home Financials for this Owner
Home Financials are based on the most recent Mortgage that was taken out on this home.
Original Mortgage
$48,000
Interest Rate
8%
Mortgage Type
Seller Take Back
Purchase Details
Closed on
Nov 10, 1995
Sold by
Obrien Geraldine and Flanagan Harold J
Bought by
Obrien Geraldine
Create a Home Valuation Report for This Property
The Home Valuation Report is an in-depth analysis detailing your home's value as well as a comparison with similar homes in the area
Home Values in the Area
Average Home Value in this Area
Purchase History
| Date | Buyer | Sale Price | Title Company |
|---|---|---|---|
| Gribbin Jennifer | -- | -- | |
| Gribbin Jennifer | -- | -- | |
| Gribbin Michael | $60,000 | Commonwealth Land Title Ins | |
| Gribbin Michael | $60,000 | Commonwealth Land Title Ins | |
| Obrien Geraldine | -- | The Title Guarantee Company | |
| Obrien Geraldine | -- | The Title Guarantee Company |
Source: Public Records
Mortgage History
| Date | Status | Borrower | Loan Amount |
|---|---|---|---|
| Open | Gribbin Jennifer | $195,500 | |
| Closed | Gribbin Jennifer | $195,500 | |
| Previous Owner | Gribbin Michael | $48,000 |
Source: Public Records
Tax History
| Year | Tax Paid | Tax Assessment Tax Assessment Total Assessment is a certain percentage of the fair market value that is determined by local assessors to be the total taxable value of land and additions on the property. | Land | Improvement |
|---|---|---|---|---|
| 2025 | $4,381 | $23,120 | $5,133 | $17,987 |
| 2024 | $4,381 | $21,812 | $4,953 | $16,859 |
| 2023 | $4,359 | $21,704 | $4,453 | $17,251 |
| 2022 | $4,190 | $31,980 | $7,140 | $24,840 |
| 2021 | $4,273 | $32,460 | $7,140 | $25,320 |
| 2020 | $4,078 | $28,500 | $7,140 | $21,360 |
| 2019 | $3,802 | $24,420 | $7,140 | $17,280 |
| 2018 | $3,687 | $18,087 | $5,995 | $12,092 |
| 2017 | $3,565 | $17,490 | $5,981 | $11,509 |
| 2016 | $3,383 | $17,490 | $5,981 | $11,509 |
| 2015 | $1,770 | $16,056 | $7,542 | $8,514 |
| 2014 | $1,770 | $15,148 | $7,116 | $8,032 |
Source: Public Records
Map
Nearby Homes
- 120 E 8th Rd
- 19 E 10th Rd
- 815 Walton Rd
- 631 Cross Bay Blvd Unit 633
- 621 Cross Bay Blvd
- 120 E 6th Rd
- 308 E 8th Rd
- 611 West Rd
- 27 W 11th Rd
- 35 W 11th Rd
- 33 W 12th Rd
- 19 W 13th Rd
- 40 W 13th Rd
- 12 W 14th Rd
- 14-7 Cross Bay Blvd
- 14-11 Cross Bay Blvd
- 12&14 W 5th Rd
- 1515 Cross Bay Blvd
- 20 W 18th Rd
- 7416 Almeda Ave
- 14 E 8th Rd
- 804 Cross Bay Blvd
- 806 Cross Bay Blvd
- 11 9 Rd
- 802 Cross Bay Blvd
- 808 Cross Bay Blvd
- 808 Cross Bay Blvd Unit 2
- 803 Church Rd
- 807 Church Rd
- 801 Church Rd
- 810 Cross Bay Blvd
- 809 Church Rd
- 15 E 9th Rd
- 13 E 9th Rd
- 17 E 9th Rd
- 811 Church Rd
- 738 Cross Bay Blvd
- 11 E 9th Rd
- 733 Church Rd
- 9 E 8th Rd
Your Personal Tour Guide
Ask me questions while you tour the home.