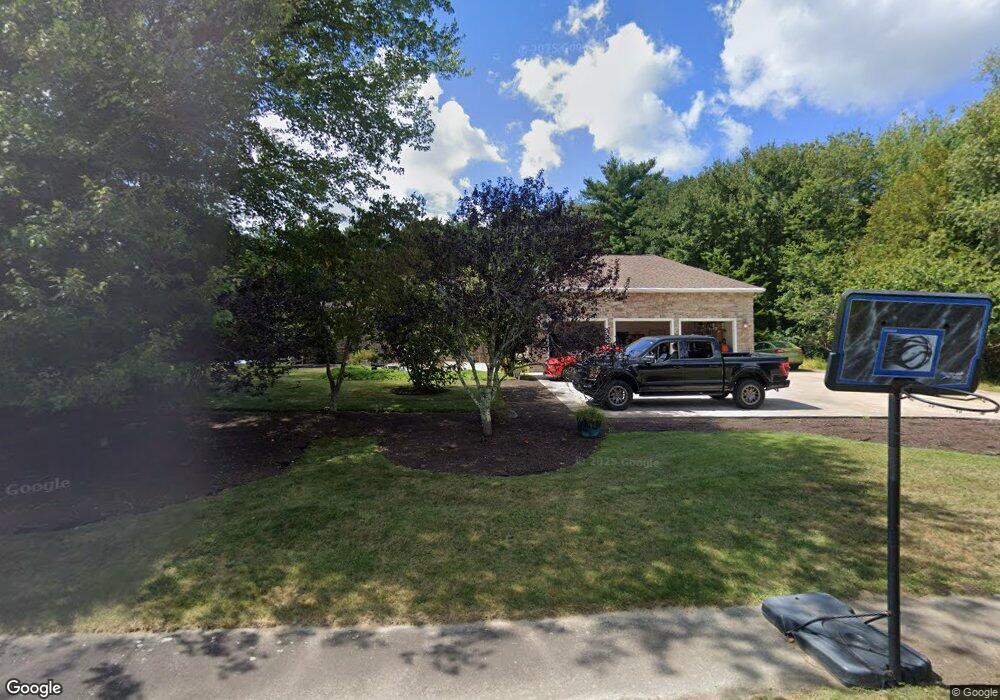
12 Edna Cir East Freetown, MA 02717
Estimated Value: $1,106,524 - $1,608,000
4
Beds
4
Baths
6,464
Sq Ft
$209/Sq Ft
Est. Value
About This Home
This home is located at 12 Edna Cir, East Freetown, MA 02717 and is currently estimated at $1,354,175, approximately $209 per square foot. 12 Edna Cir is a home located in Bristol County with nearby schools including Freetown Elementary School, George R Austin Intermediate School, and Freetown-Lakeville Middle School.
Ownership History
Date
Name
Owned For
Owner Type
Purchase Details
Closed on
Jun 11, 2025
Sold by
Andreozzi Robert J and Andreozzi Amber D
Bought by
Andreozzi Ft and Andreozzi
Current Estimated Value
Purchase Details
Closed on
Nov 15, 2011
Sold by
Barnes Lewis A and Barnes Regina M
Bought by
Andreozzi Robert J and Andreozzi Amber D
Create a Home Valuation Report for This Property
The Home Valuation Report is an in-depth analysis detailing your home's value as well as a comparison with similar homes in the area
Home Values in the Area
Average Home Value in this Area
Purchase History
| Date | Buyer | Sale Price | Title Company |
|---|---|---|---|
| Andreozzi Ft | -- | -- | |
| Andreozzi Ft | -- | -- | |
| Andreozzi Robert J | $658,900 | -- | |
| Andreozzi Robert J | $658,900 | -- |
Source: Public Records
Mortgage History
| Date | Status | Borrower | Loan Amount |
|---|---|---|---|
| Previous Owner | Andreozzi Robert J | $189,228 | |
| Previous Owner | Andreozzi Robert J | $473,604 | |
| Previous Owner | Andreozzi Robert J | $120,000 | |
| Previous Owner | Andreozzi Robert J | $475,000 |
Source: Public Records
Tax History Compared to Growth
Tax History
| Year | Tax Paid | Tax Assessment Tax Assessment Total Assessment is a certain percentage of the fair market value that is determined by local assessors to be the total taxable value of land and additions on the property. | Land | Improvement |
|---|---|---|---|---|
| 2025 | $10,147 | $1,023,900 | $257,900 | $766,000 |
| 2024 | $10,084 | $966,800 | $243,200 | $723,600 |
| 2023 | $9,958 | $929,800 | $219,000 | $710,800 |
| 2022 | $9,594 | $795,500 | $185,400 | $610,100 |
| 2021 | $9,309 | $733,000 | $168,500 | $564,500 |
| 2020 | $9,412 | $722,900 | $161,900 | $561,000 |
| 2019 | $9,030 | $686,700 | $159,700 | $527,000 |
| 2018 | $9,055 | $680,300 | $159,700 | $520,600 |
| 2017 | $8,827 | $662,700 | $159,700 | $503,000 |
| 2016 | $8,495 | $649,000 | $155,100 | $493,900 |
| 2015 | $8,256 | $640,000 | $149,700 | $490,300 |
| 2014 | $7,825 | $620,500 | $152,100 | $468,400 |
Source: Public Records
Map
Nearby Homes