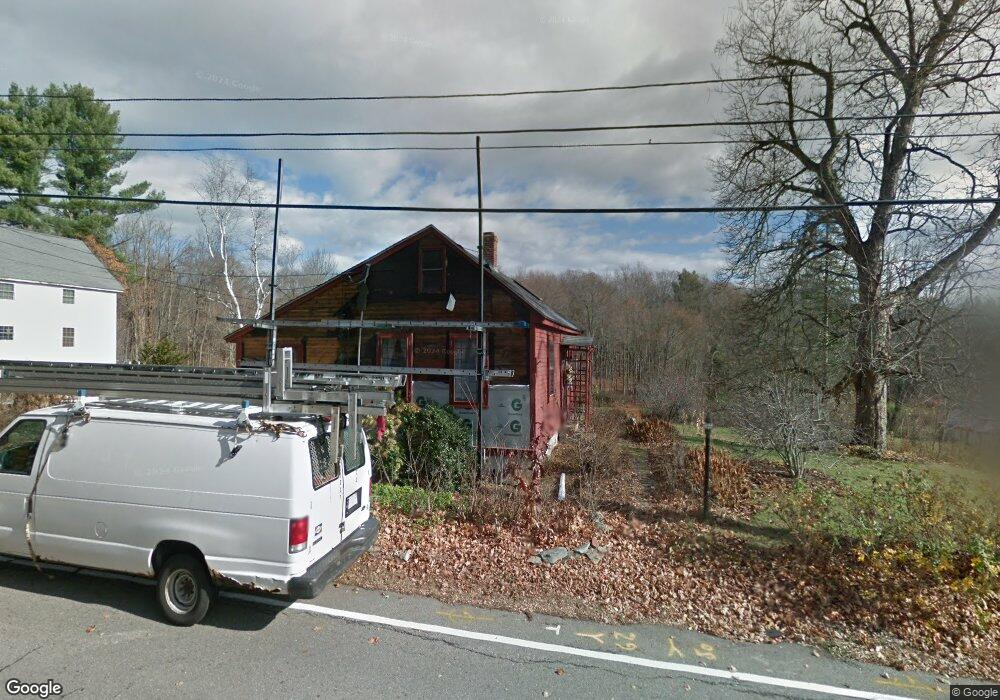
12 Elm St Pepperell, MA 01463
Estimated Value: $487,000 - $553,000
3
Beds
2
Baths
1,498
Sq Ft
$344/Sq Ft
Est. Value
About This Home
This home is located at 12 Elm St, Pepperell, MA 01463 and is currently estimated at $515,436, approximately $344 per square foot. 12 Elm St is a home located in Middlesex County with nearby schools including North Middlesex Regional High School, Pepperell Christian Academy, and Maple Dene & Moppet School.
Ownership History
Date
Name
Owned For
Owner Type
Purchase Details
Closed on
Apr 22, 2016
Sold by
Stakun Stephen P
Bought by
Stakun Ft
Current Estimated Value
Purchase Details
Closed on
Feb 6, 1963
Bought by
Stakun Ft
Create a Home Valuation Report for This Property
The Home Valuation Report is an in-depth analysis detailing your home's value as well as a comparison with similar homes in the area
Home Values in the Area
Average Home Value in this Area
Purchase History
| Date | Buyer | Sale Price | Title Company |
|---|---|---|---|
| Stakun Ft | -- | -- | |
| Stakun Ft | -- | -- |
Source: Public Records
Mortgage History
| Date | Status | Borrower | Loan Amount |
|---|---|---|---|
| Previous Owner | Stakun Ft | $73,500 | |
| Previous Owner | Stakun Ft | $130,000 | |
| Previous Owner | Stakun Ft | $70,000 |
Source: Public Records
Tax History
| Year | Tax Paid | Tax Assessment Tax Assessment Total Assessment is a certain percentage of the fair market value that is determined by local assessors to be the total taxable value of land and additions on the property. | Land | Improvement |
|---|---|---|---|---|
| 2025 | $6,267 | $428,400 | $188,400 | $240,000 |
| 2024 | $5,934 | $413,500 | $173,000 | $240,500 |
| 2023 | $5,741 | $379,200 | $146,100 | $233,100 |
| 2022 | $4,862 | $283,500 | $123,100 | $160,400 |
| 2021 | $4,580 | $255,600 | $107,700 | $147,900 |
| 2020 | $10,571 | $277,500 | $107,700 | $169,800 |
| 2019 | $4,204 | $253,400 | $107,700 | $145,700 |
| 2018 | $3,725 | $227,300 | $107,700 | $119,600 |
| 2017 | $3,491 | $219,700 | $100,000 | $119,700 |
| 2016 | $3,546 | $214,500 | $100,000 | $114,500 |
| 2015 | $3,463 | $217,100 | $100,000 | $117,100 |
| 2014 | $3,383 | $213,300 | $100,000 | $113,300 |
Source: Public Records
Map
Nearby Homes
- 38 River Rd Unit 11
- 14 Brookline St
- 21 High St
- 39 Hollis St Unit A
- 10 Bennett St
- 28-30 Groton St
- 39 Mount Lebanon St
- 109 Townsend St
- 18 Maple St Unit 14
- 120 Townsend St Unit 1
- 120 Townsend St Unit 2
- 29 Tarbell St
- 38 Tarbell St Unit 5B
- 38 Tarbell St Unit 1D
- 114 Groton St
- 10 Boynton St
- 127 Brookline St
- 33 Overlook Dr
- 122 Jewett St
- 143 Heald St
Your Personal Tour Guide
Ask me questions while you tour the home.