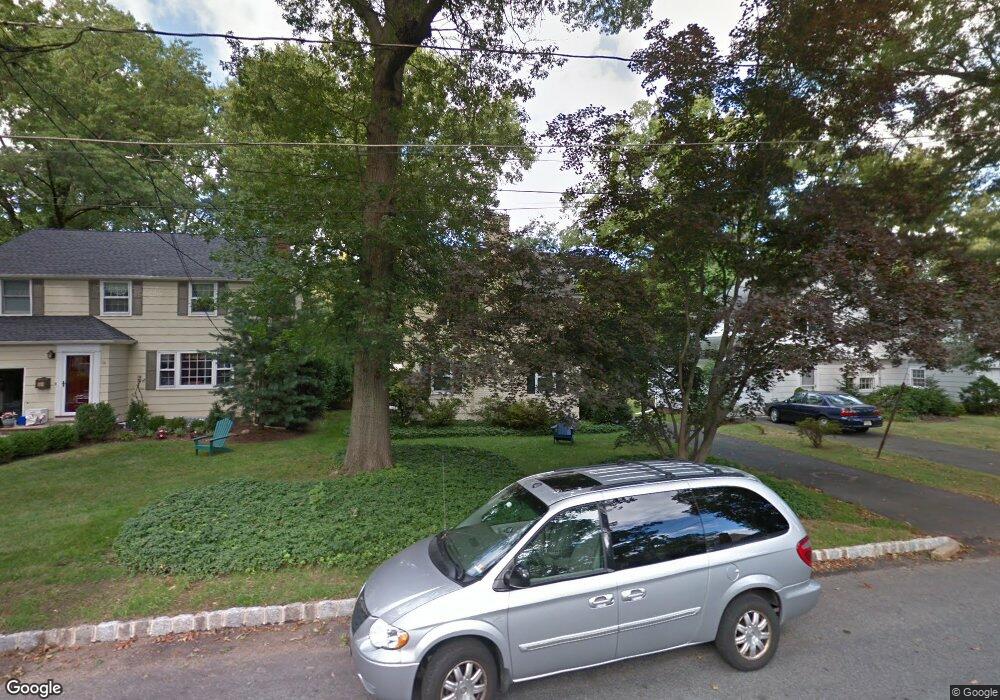
12 Essex Rd Chatham, NJ 07928
Estimated Value: $986,000 - $1,312,000
--
Bed
--
Bath
1,420
Sq Ft
$819/Sq Ft
Est. Value
About This Home
This home is located at 12 Essex Rd, Chatham, NJ 07928 and is currently estimated at $1,162,317, approximately $818 per square foot. 12 Essex Rd is a home located in Morris County with nearby schools including Chatham High School, St. Patrick School, and ECLC of New Jersey.
Ownership History
Date
Name
Owned For
Owner Type
Purchase Details
Closed on
Nov 24, 2017
Sold by
Lamar Melanie and Drake David
Bought by
Lamar Melanie
Current Estimated Value
Purchase Details
Closed on
Dec 10, 2010
Sold by
Saunders Charles T and Saunders Whitney S
Bought by
Lamar Melanie and Drake David
Home Financials for this Owner
Home Financials are based on the most recent Mortgage that was taken out on this home.
Original Mortgage
$340,750
Outstanding Balance
$226,839
Interest Rate
4.37%
Mortgage Type
New Conventional
Estimated Equity
$935,478
Purchase Details
Closed on
Apr 11, 2007
Sold by
Millet Cecelia F
Bought by
Saunders Charles T and Saunders Whitney S
Home Financials for this Owner
Home Financials are based on the most recent Mortgage that was taken out on this home.
Original Mortgage
$476,000
Interest Rate
5.87%
Mortgage Type
Purchase Money Mortgage
Purchase Details
Closed on
Oct 31, 1995
Sold by
Duede Carl M and Duede Doris S
Bought by
Millet Cecelia F
Create a Home Valuation Report for This Property
The Home Valuation Report is an in-depth analysis detailing your home's value as well as a comparison with similar homes in the area
Home Values in the Area
Average Home Value in this Area
Purchase History
| Date | Buyer | Sale Price | Title Company |
|---|---|---|---|
| Lamar Melanie | -- | None Available | |
| Lamar Melanie | $590,750 | Chicago Title Insurance Co | |
| Saunders Charles T | $626,000 | Stewart Title Guaranty Co | |
| Millet Cecelia F | $290,000 | -- |
Source: Public Records
Mortgage History
| Date | Status | Borrower | Loan Amount |
|---|---|---|---|
| Open | Lamar Melanie | $340,750 | |
| Previous Owner | Saunders Charles T | $476,000 |
Source: Public Records
Tax History Compared to Growth
Tax History
| Year | Tax Paid | Tax Assessment Tax Assessment Total Assessment is a certain percentage of the fair market value that is determined by local assessors to be the total taxable value of land and additions on the property. | Land | Improvement |
|---|---|---|---|---|
| 2025 | $14,807 | $914,600 | $715,000 | $199,600 |
| 2024 | $14,213 | $914,600 | $715,000 | $199,600 |
| 2023 | $14,213 | $914,600 | $715,000 | $199,600 |
| 2022 | $13,891 | $650,000 | $537,600 | $112,400 |
| 2021 | $13,891 | $650,000 | $537,600 | $112,400 |
| 2020 | $13,774 | $650,000 | $537,600 | $112,400 |
| 2019 | $13,676 | $650,000 | $537,600 | $112,400 |
| 2018 | $13,293 | $650,000 | $537,600 | $112,400 |
| 2017 | $12,909 | $650,000 | $537,600 | $112,400 |
| 2016 | $12,571 | $650,000 | $537,600 | $112,400 |
| 2015 | $12,422 | $650,000 | $537,600 | $112,400 |
| 2014 | $12,331 | $650,000 | $537,600 | $112,400 |
Source: Public Records
Map
Nearby Homes
- 5 Woodland Rd
- 38 Essex Rd
- 380 Main St Unit 5
- 17 Coleman Ave W
- 1 John St
- 85 Kings Rd
- 3 Woodland Rd
- 380 Main St Unit19
- 128 Fairmount Ave
- 30 Hillside Ave
- 44 Brooklake Rd
- 3 Durwood Place
- 318 Main St Unit 34
- 47 Red Rd
- 47 Niles Ave
- 102 Center Ave
- 11 Dellwood Ave
- 24 Bridge St
- 25 Roosevelt Ave
- 16 Driftway St