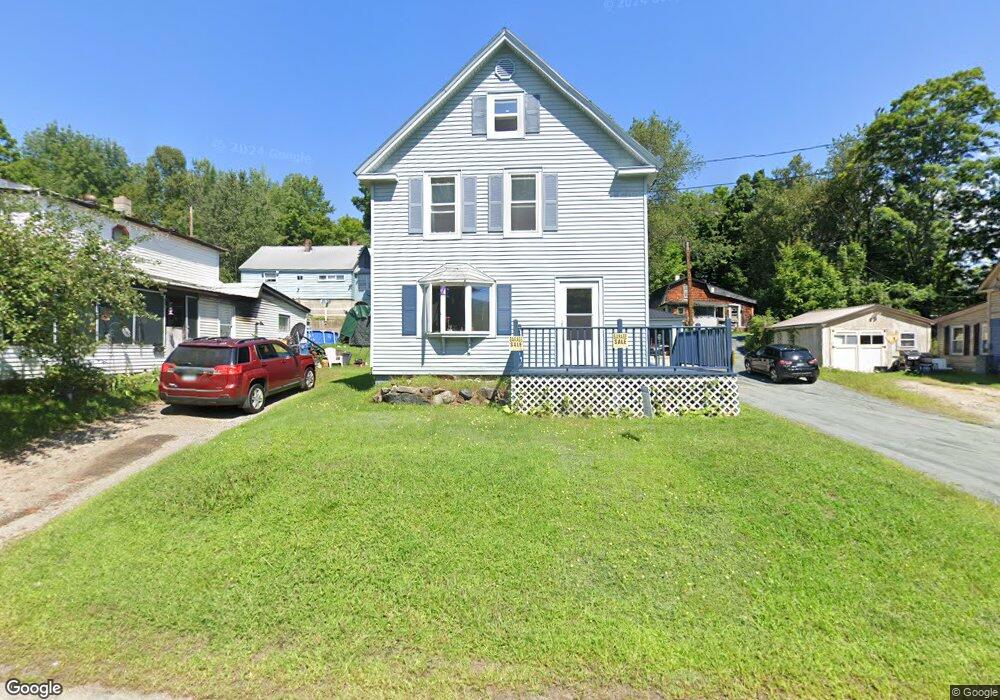
12 Fiske St Groveton, NH 03582
Estimated Value: $132,275 - $251,000
4
Beds
2
Baths
2,284
Sq Ft
$77/Sq Ft
Est. Value
About This Home
This home is located at 12 Fiske St, Groveton, NH 03582 and is currently estimated at $176,569, approximately $77 per square foot. 12 Fiske St is a home located in Coos County with nearby schools including Groveton Elementary School and Groveton High School.
Ownership History
Date
Name
Owned For
Owner Type
Purchase Details
Closed on
Aug 9, 2024
Sold by
Laflamme Roland H and Laflamme Debra A
Bought by
Thurston Matthew
Current Estimated Value
Home Financials for this Owner
Home Financials are based on the most recent Mortgage that was taken out on this home.
Original Mortgage
$111,550
Outstanding Balance
$110,285
Interest Rate
6.86%
Mortgage Type
Purchase Money Mortgage
Estimated Equity
$66,284
Create a Home Valuation Report for This Property
The Home Valuation Report is an in-depth analysis detailing your home's value as well as a comparison with similar homes in the area
Home Values in the Area
Average Home Value in this Area
Purchase History
| Date | Buyer | Sale Price | Title Company |
|---|---|---|---|
| Thurston Matthew | $115,000 | None Available | |
| Thurston Matthew | $115,000 | None Available |
Source: Public Records
Mortgage History
| Date | Status | Borrower | Loan Amount |
|---|---|---|---|
| Open | Thurston Matthew | $111,550 | |
| Closed | Thurston Matthew | $111,550 |
Source: Public Records
Tax History Compared to Growth
Tax History
| Year | Tax Paid | Tax Assessment Tax Assessment Total Assessment is a certain percentage of the fair market value that is determined by local assessors to be the total taxable value of land and additions on the property. | Land | Improvement |
|---|---|---|---|---|
| 2024 | $2,679 | $119,390 | $39,300 | $80,090 |
| 2023 | $2,553 | $119,390 | $39,300 | $80,090 |
| 2022 | $1,857 | $56,160 | $9,400 | $46,760 |
| 2021 | $1,983 | $56,160 | $9,400 | $46,760 |
| 2020 | $1,854 | $56,160 | $9,400 | $46,760 |
| 2019 | $1,832 | $56,460 | $9,400 | $47,060 |
| 2018 | $1,962 | $56,460 | $9,400 | $47,060 |
| 2016 | $2,311 | $62,800 | $10,600 | $52,200 |
| 2015 | $2,179 | $62,800 | $10,600 | $52,200 |
| 2013 | $2,103 | $62,800 | $10,600 | $52,200 |
Source: Public Records
Map
Nearby Homes
- 13 Hillside Ave
- 41 Crow Hill St
- 18 State St
- 50 Church St
- 102 Hillside Ave
- 14 Summer St
- 88 State St
- 38 Riverside Dr
- 406 New Hampshire 110
- 1435 Lost Nation Rd
- 413 Lancaster Rd
- 35 Marietta Ln
- 8 Sunset Ct
- 109 Dean Brook Dr
- 114 U S 3
- 0 Town Line Rd Unit 1 and 33 4953131
- 147 U S 3
- 300 Ridgwell Ln
- 238 Northside Rd
- 65 Hollow Rd