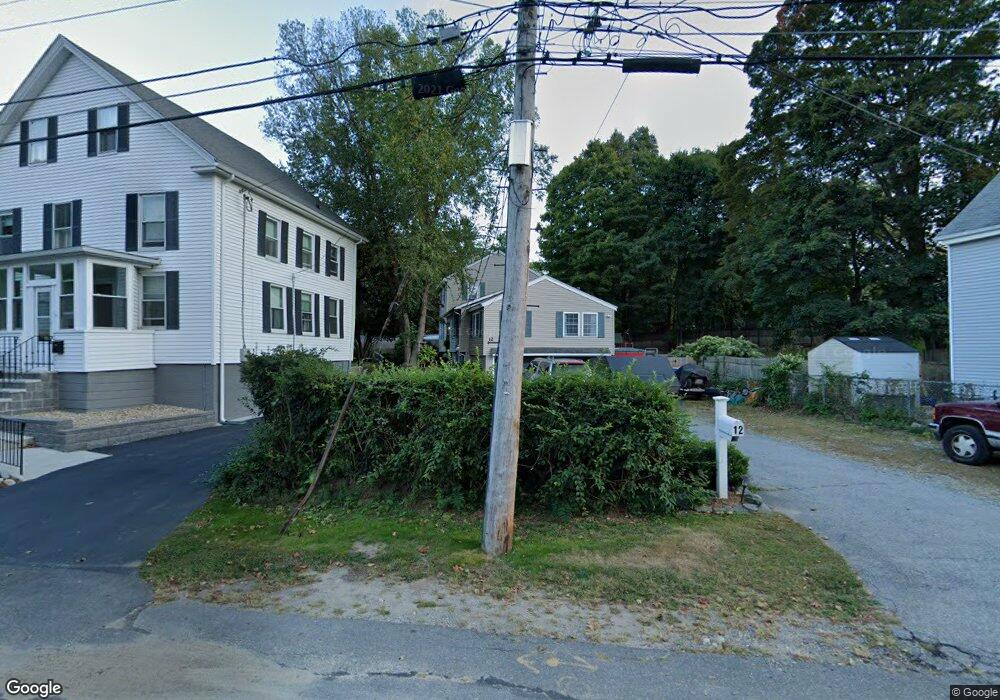
12 Fitch Ct Wakefield, MA 01880
Lakeside NeighborhoodEstimated Value: $766,000 - $808,000
2
Beds
1
Bath
1,693
Sq Ft
$467/Sq Ft
Est. Value
About This Home
This home is located at 12 Fitch Ct, Wakefield, MA 01880 and is currently estimated at $790,451, approximately $466 per square foot. 12 Fitch Ct is a home located in Middlesex County with nearby schools including Wakefield Memorial High School, St Joseph School, and Odyssey Day School.
Ownership History
Date
Name
Owned For
Owner Type
Purchase Details
Closed on
May 18, 1983
Bought by
Lyons Kevin M and Lyons Cynthia F
Current Estimated Value
Create a Home Valuation Report for This Property
The Home Valuation Report is an in-depth analysis detailing your home's value as well as a comparison with similar homes in the area
Home Values in the Area
Average Home Value in this Area
Purchase History
| Date | Buyer | Sale Price | Title Company |
|---|---|---|---|
| Lyons Kevin M | $20,000 | -- |
Source: Public Records
Mortgage History
| Date | Status | Borrower | Loan Amount |
|---|---|---|---|
| Open | Lyons Kevin M | $271,500 | |
| Closed | Lyons Kevin M | $33,000 |
Source: Public Records
Tax History Compared to Growth
Tax History
| Year | Tax Paid | Tax Assessment Tax Assessment Total Assessment is a certain percentage of the fair market value that is determined by local assessors to be the total taxable value of land and additions on the property. | Land | Improvement |
|---|---|---|---|---|
| 2025 | $8,303 | $731,500 | $382,800 | $348,700 |
| 2024 | $8,182 | $727,300 | $380,600 | $346,700 |
| 2023 | $7,782 | $663,400 | $347,100 | $316,300 |
| 2022 | $7,445 | $604,300 | $316,100 | $288,200 |
| 2021 | $7,578 | $595,300 | $294,600 | $300,700 |
| 2020 | $7,108 | $556,600 | $275,500 | $281,100 |
| 2019 | $6,790 | $529,200 | $261,900 | $267,300 |
| 2018 | $6,321 | $488,100 | $241,600 | $246,500 |
| 2017 | $5,944 | $456,200 | $225,800 | $230,400 |
| 2016 | $5,710 | $423,300 | $213,600 | $209,700 |
| 2015 | $5,333 | $395,600 | $199,600 | $196,000 |
| 2014 | $4,862 | $380,400 | $191,900 | $188,500 |
Source: Public Records
Map
Nearby Homes
- 13 Highland St
- 24 Park St
- 16 Pleasant St
- 22 Wayland Rd
- 11 Wilson Ave
- 48 Cordis St
- 51 Crescent St
- 29 Cordis St
- 6 Blue Jay Cir Unit 2
- 9 Avon St Unit 2
- 50 Albion St
- 22 Jefferson Rd
- 314 Water St Unit 5
- 5 Bateman Ct Unit 5
- 1 Mansfield Dr
- 38 Bennett St Unit 3D
- 6 Avon Ct Unit 2
- 270 Lowell St
- 9 Nelson Ave
- 47 Emerson St
- 10 Fitch Ct
- 8 Fitch Ct
- 131 Vernon St
- 4 Fitch Ct
- 9 Fitch Ct Unit B
- 9 Fitch Ct Unit A
- 9 Fitch Ct
- 9 Fitch Ct Unit 9A
- 11 Fitch Ct Unit B
- 11 Fitch Ct Unit A
- 11 Fitch Ct
- 11 Fitch Ct Unit 11A
- 11A Fitch Ct Unit A
- 2 Fitch Ct
- 2 Fitch Ct Unit Second floor
- 2 Fitch Ct Unit 2
- 2 Fitch Ct Unit 1
- 125 Vernon St
- 129 Vernon St
- 7 Fitch Ct