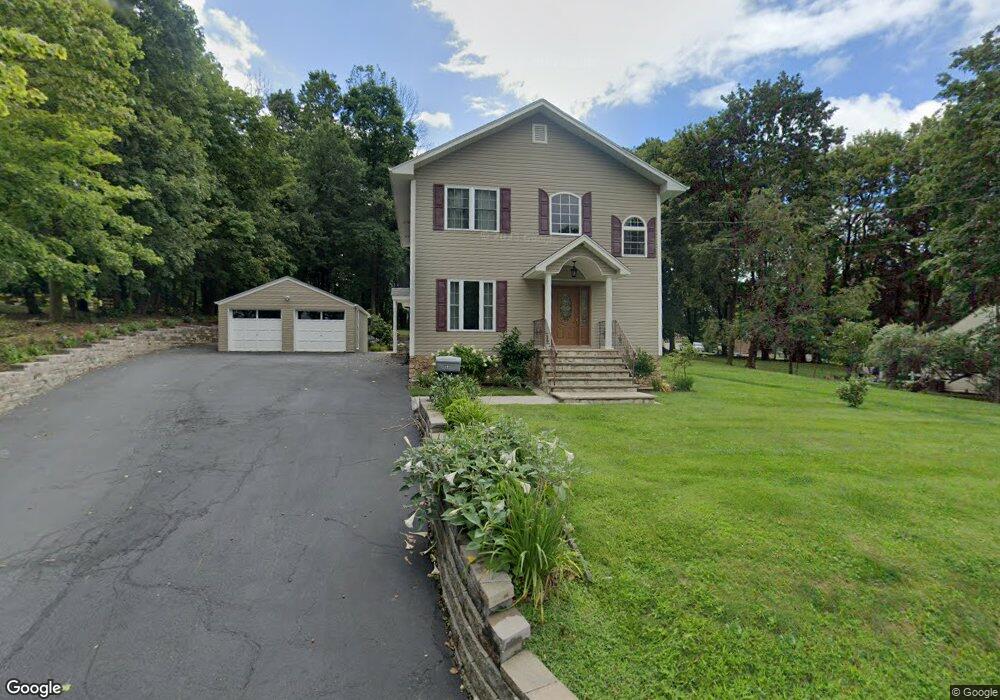
12 Flanders Rd Budd Lake, NJ 07828
Estimated Value: $507,000 - $712,000
--
Bed
--
Bath
2,296
Sq Ft
$256/Sq Ft
Est. Value
About This Home
This home is located at 12 Flanders Rd, Budd Lake, NJ 07828 and is currently estimated at $587,549, approximately $255 per square foot. 12 Flanders Rd is a home located in Morris County with nearby schools including Mt Olive Middle School and Mount Olive High School.
Ownership History
Date
Name
Owned For
Owner Type
Purchase Details
Closed on
Oct 31, 2003
Sold by
Mioduszewski Adam
Bought by
Kambo Jim and Kambo Vjollca
Current Estimated Value
Home Financials for this Owner
Home Financials are based on the most recent Mortgage that was taken out on this home.
Original Mortgage
$206,000
Outstanding Balance
$95,569
Interest Rate
6.01%
Estimated Equity
$491,981
Purchase Details
Closed on
Jun 30, 1997
Sold by
Lundberg Erik B and Lundberg Jean
Bought by
Mioduszewski Adam and Mioduszewski Lisa
Home Financials for this Owner
Home Financials are based on the most recent Mortgage that was taken out on this home.
Original Mortgage
$141,100
Interest Rate
7.86%
Mortgage Type
FHA
Create a Home Valuation Report for This Property
The Home Valuation Report is an in-depth analysis detailing your home's value as well as a comparison with similar homes in the area
Home Values in the Area
Average Home Value in this Area
Purchase History
| Date | Buyer | Sale Price | Title Company |
|---|---|---|---|
| Kambo Jim | $229,900 | -- | |
| Mioduszewski Adam | $143,000 | Fidelity National Title Ins |
Source: Public Records
Mortgage History
| Date | Status | Borrower | Loan Amount |
|---|---|---|---|
| Open | Kambo Jim | $206,000 | |
| Previous Owner | Mioduszewski Adam | $141,100 |
Source: Public Records
Tax History Compared to Growth
Tax History
| Year | Tax Paid | Tax Assessment Tax Assessment Total Assessment is a certain percentage of the fair market value that is determined by local assessors to be the total taxable value of land and additions on the property. | Land | Improvement |
|---|---|---|---|---|
| 2025 | $10,162 | $291,600 | $138,500 | $153,100 |
| 2024 | $9,585 | $291,600 | $138,500 | $153,100 |
| 2023 | $9,585 | $291,600 | $138,500 | $153,100 |
| 2022 | $9,792 | $291,600 | $138,500 | $153,100 |
| 2021 | $9,792 | $291,600 | $138,500 | $153,100 |
| 2020 | $9,661 | $291,600 | $138,500 | $153,100 |
| 2019 | $9,629 | $291,600 | $138,500 | $153,100 |
| 2018 | $9,535 | $291,600 | $138,500 | $153,100 |
| 2017 | $9,369 | $291,600 | $138,500 | $153,100 |
| 2016 | $9,072 | $291,600 | $138,500 | $153,100 |
| 2015 | $9,285 | $291,600 | $138,500 | $153,100 |
| 2014 | $9,293 | $291,600 | $138,500 | $153,100 |
Source: Public Records
Map
Nearby Homes