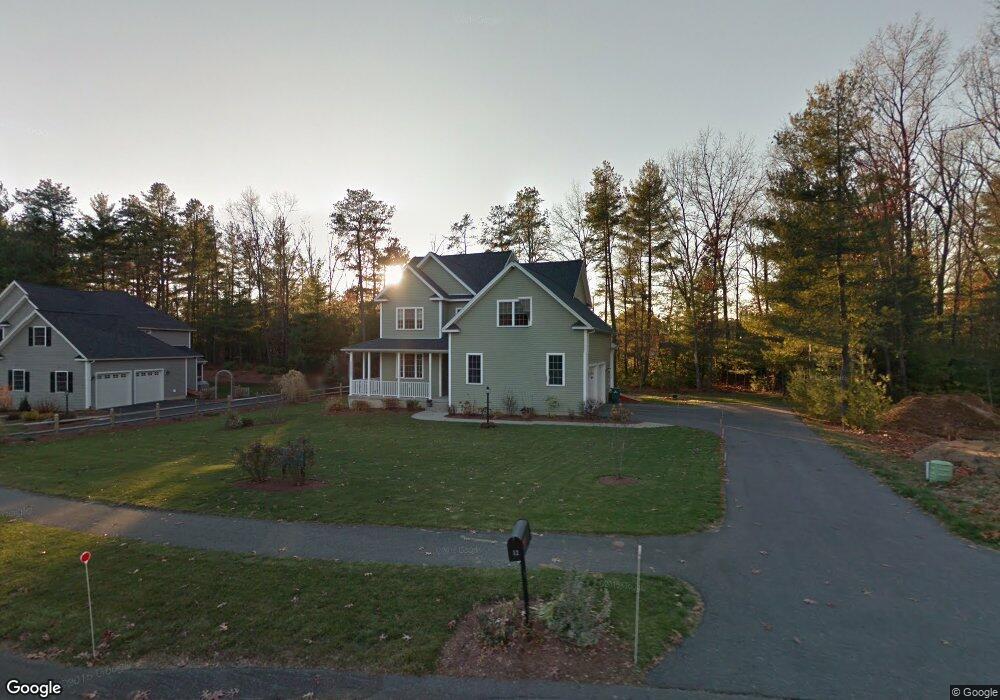
12 Fox Run Easthampton, MA 01027
Estimated Value: $766,263 - $912,000
4
Beds
3
Baths
2,864
Sq Ft
$291/Sq Ft
Est. Value
About This Home
This home is located at 12 Fox Run, Easthampton, MA 01027 and is currently estimated at $832,066, approximately $290 per square foot. 12 Fox Run is a home located in Hampshire County with nearby schools including Easthampton High School, Calvary Baptist Christian School, and Tri-County Schools.
Ownership History
Date
Name
Owned For
Owner Type
Purchase Details
Closed on
Aug 30, 2011
Sold by
Gram Richard C and Gram Alicia J
Bought by
Wang Sean and Twardowski Margrette
Current Estimated Value
Home Financials for this Owner
Home Financials are based on the most recent Mortgage that was taken out on this home.
Original Mortgage
$332,000
Outstanding Balance
$230,263
Interest Rate
4.53%
Mortgage Type
Purchase Money Mortgage
Estimated Equity
$601,804
Purchase Details
Closed on
Mar 16, 2010
Sold by
David A Hardy Contr Ll
Bought by
Gram Richard C and Gram Alicia J
Create a Home Valuation Report for This Property
The Home Valuation Report is an in-depth analysis detailing your home's value as well as a comparison with similar homes in the area
Home Values in the Area
Average Home Value in this Area
Purchase History
| Date | Buyer | Sale Price | Title Company |
|---|---|---|---|
| Wang Sean | $415,000 | -- | |
| Gram Richard C | $440,900 | -- |
Source: Public Records
Mortgage History
| Date | Status | Borrower | Loan Amount |
|---|---|---|---|
| Open | Wang Sean | $332,000 |
Source: Public Records
Tax History
| Year | Tax Paid | Tax Assessment Tax Assessment Total Assessment is a certain percentage of the fair market value that is determined by local assessors to be the total taxable value of land and additions on the property. | Land | Improvement |
|---|---|---|---|---|
| 2025 | $9,114 | $666,700 | $131,600 | $535,100 |
| 2024 | $8,787 | $648,000 | $127,800 | $520,200 |
| 2023 | $6,478 | $442,200 | $100,500 | $341,700 |
| 2022 | $7,310 | $442,200 | $100,500 | $341,700 |
| 2021 | $8,082 | $460,800 | $100,500 | $360,300 |
| 2020 | $7,853 | $442,200 | $100,500 | $341,700 |
| 2019 | $6,980 | $451,500 | $117,200 | $334,300 |
| 2018 | $6,698 | $418,600 | $110,400 | $308,200 |
| 2017 | $6,537 | $403,300 | $106,200 | $297,100 |
| 2016 | $6,383 | $409,400 | $106,200 | $303,200 |
| 2015 | $6,202 | $409,400 | $106,200 | $303,200 |
Source: Public Records
Map
Nearby Homes
Your Personal Tour Guide
Ask me questions while you tour the home.