T
Seller's Agent in 2012
Theresa Scatterday
J. Barrett & Company
(978) 729-3096
14 in this area
21 Total Sales

Estimated Value: $556,000 - $657,000
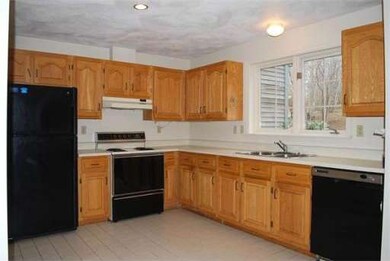
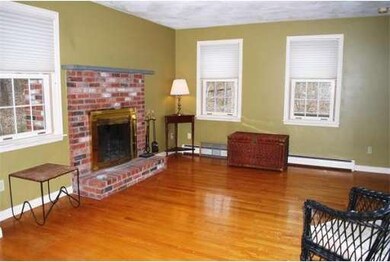
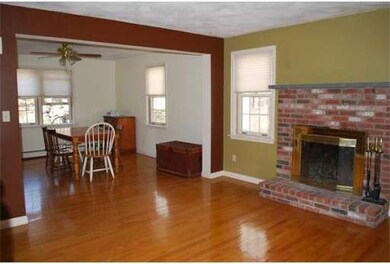
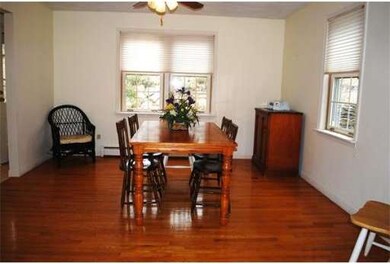
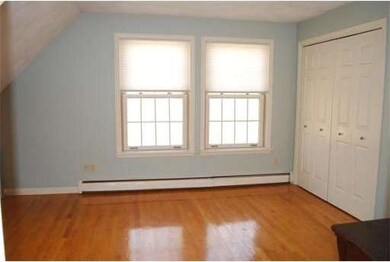
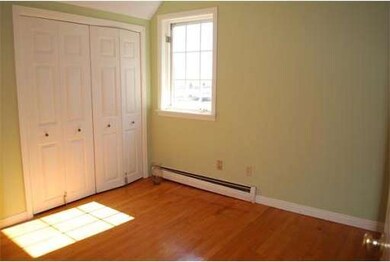
Spacious townhome located on a quiet street in Rockport's South End and just steps away from Cape Hedge and Long beaches. Open Living/Dining Rm, 2+bedrooms with additional finished space in lower level. Sit on your private deck, listen to the sounds of the gentle babbling brook and smell the ocean with distant water views. Perfect starter home or vacation getaway. Don't miss this opportunity to own in Rockport at an affordable price!
Last Buyer's Agent
Nancy MacDowell
J. Barrett & Company License #454000425
| Date | Buyer | Sale Price | Title Company |
|---|---|---|---|
| Comiskey Robert V | $375,000 | -- | |
| Jones Robin C | $169,000 | -- |
| Date | Status | Borrower | Loan Amount |
|---|---|---|---|
| Open | Young Lynne E | $100,000 | |
| Open | Young Lynne E | $247,500 | |
| Closed | Jones Robin C | $230,000 | |
| Closed | Jones Robin C | $208,000 | |
| Previous Owner | Jones Robin C | $152,100 |
| Date | Event | Price | Change | Sq Ft Price |
|---|---|---|---|---|
| 06/12/2012 06/12/12 | Sold | $260,000 | -6.8% | $232 / Sq Ft |
| 05/27/2012 05/27/12 | Pending | -- | -- | -- |
| 03/29/2012 03/29/12 | For Sale | $279,000 | -- | $249 / Sq Ft |
| Year | Tax Paid | Tax Assessment Tax Assessment Total Assessment is a certain percentage of the fair market value that is determined by local assessors to be the total taxable value of land and additions on the property. | Land | Improvement |
|---|---|---|---|---|
| 2025 | $3,815 | $435,500 | $0 | $435,500 |
| 2024 | $3,559 | $422,700 | $0 | $422,700 |
| 2023 | $3,864 | $409,800 | $0 | $409,800 |
| 2022 | $3,848 | $391,900 | $0 | $391,900 |
| 2021 | $3,127 | $321,000 | $0 | $321,000 |
| 2020 | $3,197 | $316,500 | $0 | $316,500 |
| 2019 | $3,121 | $316,500 | $0 | $316,500 |
| 2018 | $2,926 | $289,400 | $0 | $289,400 |
| 2017 | $3,111 | $275,800 | $0 | $275,800 |
| 2016 | $2,967 | $263,700 | $0 | $263,700 |
| 2015 | $2,851 | $259,200 | $0 | $259,200 |
| 2014 | $2,781 | $246,800 | $0 | $246,800 |
T
Seller's Agent in 2012
Theresa Scatterday
J. Barrett & Company
(978) 729-3096
14 in this area
21 Total Sales
N
Buyer's Agent in 2012
Nancy MacDowell
J. Barrett & Company
Source: MLS Property Information Network (MLS PIN)
MLS Number: 71359085
APN: 24 1 4 M
Disclaimer: Certain information contained herein is derived from information provided by parties other than Homes.com. All information provided is deemed reliable, but is not guaranteed to be accurate and should be independently verified.
![]() The property listing data and information, or the Images, set forth herein were provided to MLS Property Information Network, Inc. from third party sources, including sellers, lessors and public records, and were compiled by MLS Property Information Network, Inc. The property listing data and information, and the Images, are for the personal, non-commercial use of consumers having a good faith interest in purchasing or leasing listed properties of the type displayed to them and may not be used for any purpose other than to identify prospective properties which such consumers may have a good faith interest in purchasing or leasing. MLS Property Information Network, Inc. and its subscribers disclaim any and all representations and warranties as to the accuracy of the property listing data and information, or as to the accuracy of any of the Images, set forth herein.
The property listing data and information, or the Images, set forth herein were provided to MLS Property Information Network, Inc. from third party sources, including sellers, lessors and public records, and were compiled by MLS Property Information Network, Inc. The property listing data and information, and the Images, are for the personal, non-commercial use of consumers having a good faith interest in purchasing or leasing listed properties of the type displayed to them and may not be used for any purpose other than to identify prospective properties which such consumers may have a good faith interest in purchasing or leasing. MLS Property Information Network, Inc. and its subscribers disclaim any and all representations and warranties as to the accuracy of the property listing data and information, or as to the accuracy of any of the Images, set forth herein.
