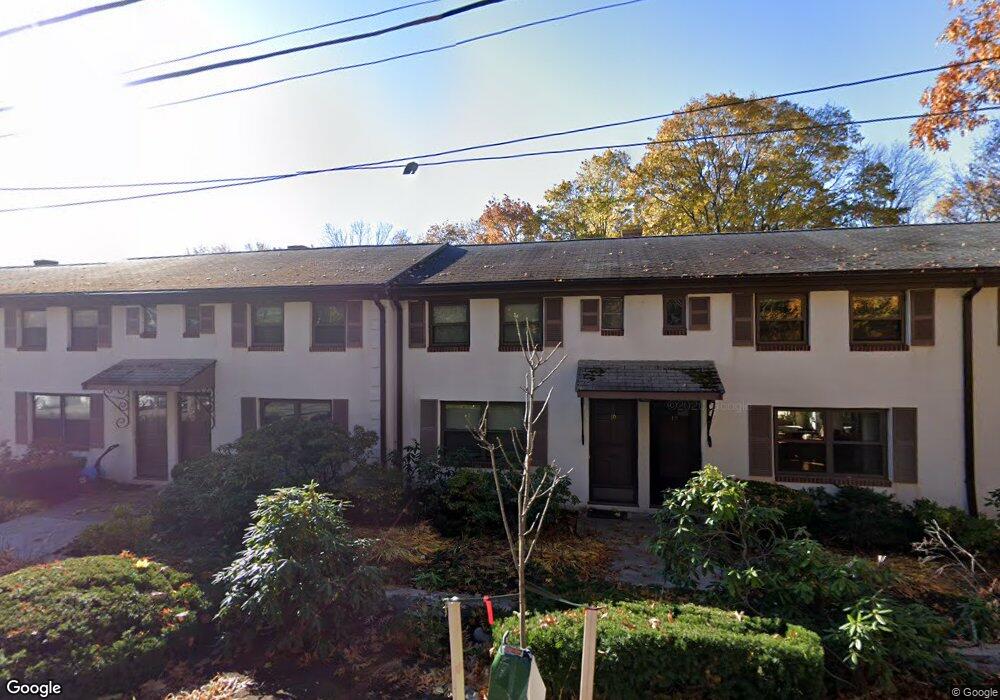
12 Frazer Rd Unit 12,12 Arlington, MA 02476
Arlington Heights NeighborhoodEstimated Value: $624,000 - $704,000
2
Beds
1
Bath
1,150
Sq Ft
$577/Sq Ft
Est. Value
About This Home
This home is located at 12 Frazer Rd Unit 12,12, Arlington, MA 02476 and is currently estimated at $663,211, approximately $576 per square foot. 12 Frazer Rd Unit 12,12 is a home located in Middlesex County with nearby schools including Peirce Elementary School, Ottoson Middle School, and Arlington High School.
Ownership History
Date
Name
Owned For
Owner Type
Purchase Details
Closed on
Feb 28, 2003
Sold by
Bennett Leah M
Bought by
Titus Elizabeth O
Current Estimated Value
Home Financials for this Owner
Home Financials are based on the most recent Mortgage that was taken out on this home.
Original Mortgage
$227,200
Outstanding Balance
$98,386
Interest Rate
5.98%
Mortgage Type
Purchase Money Mortgage
Estimated Equity
$564,825
Purchase Details
Closed on
Oct 15, 1999
Sold by
Dirin Masood
Bought by
Bennett Leah M
Home Financials for this Owner
Home Financials are based on the most recent Mortgage that was taken out on this home.
Original Mortgage
$164,250
Interest Rate
7.8%
Mortgage Type
Purchase Money Mortgage
Purchase Details
Closed on
Jun 2, 1997
Sold by
Hanson Mary L
Bought by
Dirin Masood
Home Financials for this Owner
Home Financials are based on the most recent Mortgage that was taken out on this home.
Original Mortgage
$116,850
Interest Rate
8.09%
Mortgage Type
Purchase Money Mortgage
Create a Home Valuation Report for This Property
The Home Valuation Report is an in-depth analysis detailing your home's value as well as a comparison with similar homes in the area
Home Values in the Area
Average Home Value in this Area
Purchase History
| Date | Buyer | Sale Price | Title Company |
|---|---|---|---|
| Titus Elizabeth O | $307,000 | -- | |
| Bennett Leah M | $182,500 | -- | |
| Dirin Masood | $123,000 | -- |
Source: Public Records
Mortgage History
| Date | Status | Borrower | Loan Amount |
|---|---|---|---|
| Open | Titus Elizabeth O | $227,200 | |
| Previous Owner | Dirin Masood | $161,000 | |
| Previous Owner | Dirin Masood | $164,250 | |
| Previous Owner | Dirin Masood | $116,800 | |
| Previous Owner | Dirin Masood | $116,850 |
Source: Public Records
Tax History Compared to Growth
Tax History
| Year | Tax Paid | Tax Assessment Tax Assessment Total Assessment is a certain percentage of the fair market value that is determined by local assessors to be the total taxable value of land and additions on the property. | Land | Improvement |
|---|---|---|---|---|
| 2025 | $5,296 | $491,700 | $0 | $491,700 |
| 2024 | $5,068 | $478,600 | $0 | $478,600 |
| 2023 | $4,710 | $420,200 | $0 | $420,200 |
| 2022 | $4,633 | $405,700 | $0 | $405,700 |
| 2021 | $4,519 | $398,500 | $0 | $398,500 |
| 2020 | $4,327 | $391,200 | $0 | $391,200 |
| 2019 | $4,242 | $376,700 | $0 | $376,700 |
| 2018 | $4,148 | $342,000 | $0 | $342,000 |
| 2017 | $3,840 | $305,700 | $0 | $305,700 |
| 2016 | $3,913 | $305,700 | $0 | $305,700 |
| 2015 | $3,927 | $289,800 | $0 | $289,800 |
Source: Public Records
Map
Nearby Homes
- 4 Beck Rd
- 11 Lowell St Unit B
- 1205 Massachusetts Ave
- 1 Watermill Place Unit 308
- 51 Lowell St
- 6 Appleton Place
- 14 Burton St Unit 16
- 14 Park Avenue Extension
- 15 Higgins St Unit 17
- 58 Westminster Ave Unit 58
- 18-20 Brattle St
- 10 Colonial Village Dr Unit 2
- 1025 Massachusetts Ave Unit 204
- 204 Plan at Majestic Mill Brook
- 1025 Massachusetts Ave Unit 404
- 1025 Massachusetts Ave Unit 506
- 1025 Massachusetts Ave Unit 401
- 1025 Massachusetts Ave Unit 210
- 1025 Massachusetts Ave Unit 402
- 1025 Massachusetts Ave Unit 308
- 16 Frazer Rd
- 14 Frazer Rd
- 12 Frazer Rd
- 8 Frazer Rd
- 16 Frazer Rd Unit 16
- 2 Frazer Rd Unit 2
- 4 Frazer Rd Unit A
- 4 Frazer Rd Unit B
- 2 Frazer Rd Unit A
- 2 Frazer Rd Unit B
- 4 Frazer Rd Unit 4
- 2A Frazer Rd Unit 2A
- 4 A Frazer Rd Unit 4A
- 6 Frazer Rd Unit 1
- 10 Frazer Rd
- 6 Frazer Rd
- 6 Frazer Rd Unit 6
- 34 Clark St Unit 15
- 34 Clark St Unit 14
- 34 Clark St Unit 13