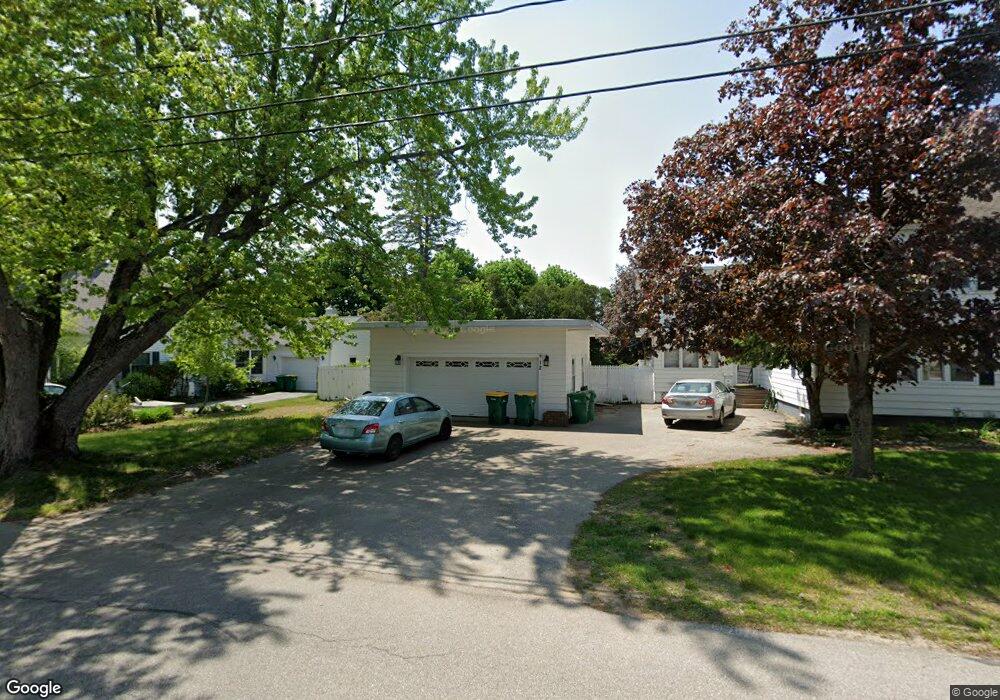
12 Furbush St Unit 1 Rochester, NH 03867
Estimated Value: $457,000 - $529,784
4
Beds
2
Baths
1,100
Sq Ft
$449/Sq Ft
Est. Value
About This Home
This home is located at 12 Furbush St Unit 1, Rochester, NH 03867 and is currently estimated at $494,196, approximately $449 per square foot. 12 Furbush St Unit 1 is a home located in Strafford County with nearby schools including School Street School, Rochester Middle School, and Spaulding High School.
Ownership History
Date
Name
Owned For
Owner Type
Purchase Details
Closed on
Jun 12, 2017
Sold by
Mcgillvray Robin M and Howard Jesse D
Bought by
Mcgilvray Robin M and Mcgilvray Gary D
Current Estimated Value
Purchase Details
Closed on
Dec 9, 2011
Sold by
Department Of Housing & Urban Dev
Bought by
Mcgilvray Robin M and Howard Jesse D
Home Financials for this Owner
Home Financials are based on the most recent Mortgage that was taken out on this home.
Original Mortgage
$161,733
Interest Rate
4.09%
Mortgage Type
Purchase Money Mortgage
Purchase Details
Closed on
Jul 5, 2000
Sold by
Miniicucci Gene and Miniicucci Edith
Bought by
Dutil Thomas J and Dutil Melissa A
Home Financials for this Owner
Home Financials are based on the most recent Mortgage that was taken out on this home.
Original Mortgage
$178,429
Interest Rate
8.55%
Create a Home Valuation Report for This Property
The Home Valuation Report is an in-depth analysis detailing your home's value as well as a comparison with similar homes in the area
Home Values in the Area
Average Home Value in this Area
Purchase History
| Date | Buyer | Sale Price | Title Company |
|---|---|---|---|
| Mcgilvray Robin M | -- | -- | |
| Mcgilvray Robin M | $154,700 | -- | |
| Dutil Thomas J | $179,900 | -- |
Source: Public Records
Mortgage History
| Date | Status | Borrower | Loan Amount |
|---|---|---|---|
| Previous Owner | Dutil Thomas J | $161,733 | |
| Previous Owner | Dutil Thomas J | $353,102 | |
| Previous Owner | Dutil Thomas J | $178,429 |
Source: Public Records
Tax History Compared to Growth
Tax History
| Year | Tax Paid | Tax Assessment Tax Assessment Total Assessment is a certain percentage of the fair market value that is determined by local assessors to be the total taxable value of land and additions on the property. | Land | Improvement |
|---|---|---|---|---|
| 2024 | $7,473 | $503,200 | $113,600 | $389,600 |
| 2023 | $6,530 | $253,700 | $41,200 | $212,500 |
| 2022 | $6,414 | $253,700 | $41,200 | $212,500 |
| 2021 | $6,254 | $253,700 | $41,200 | $212,500 |
| 2020 | $6,209 | $252,300 | $41,200 | $211,100 |
| 2019 | $6,282 | $252,300 | $41,200 | $211,100 |
| 2018 | $4,989 | $181,300 | $36,600 | $144,700 |
| 2017 | $4,774 | $181,300 | $36,600 | $144,700 |
| 2016 | $4,129 | $146,100 | $36,600 | $109,500 |
| 2015 | $4,113 | $146,100 | $36,600 | $109,500 |
| 2014 | $4,013 | $146,100 | $36,600 | $109,500 |
| 2013 | $4,257 | $161,500 | $50,400 | $111,100 |
| 2012 | $4,147 | $161,500 | $50,400 | $111,100 |
Source: Public Records
Map
Nearby Homes
- 1 Farrington St
- 17 Winter St
- 15 Linden St
- 67 Winter St
- 45 Hanson St
- 47 Hanson St
- 10 Sarah Ct
- 38 Western Ave
- 57 Congress St
- 7 Mcintire Ct
- 3 Dodge St
- 32 Adams Ave
- 56 Chamberlain St
- 0 Franklin St Unit 55 4959653
- 86 Wakefield St
- 105 Wakefield St
- 51 Chestnut St
- 35 Franklin Heights
- 10 Lady Slipper Ct
- 22 Corson St