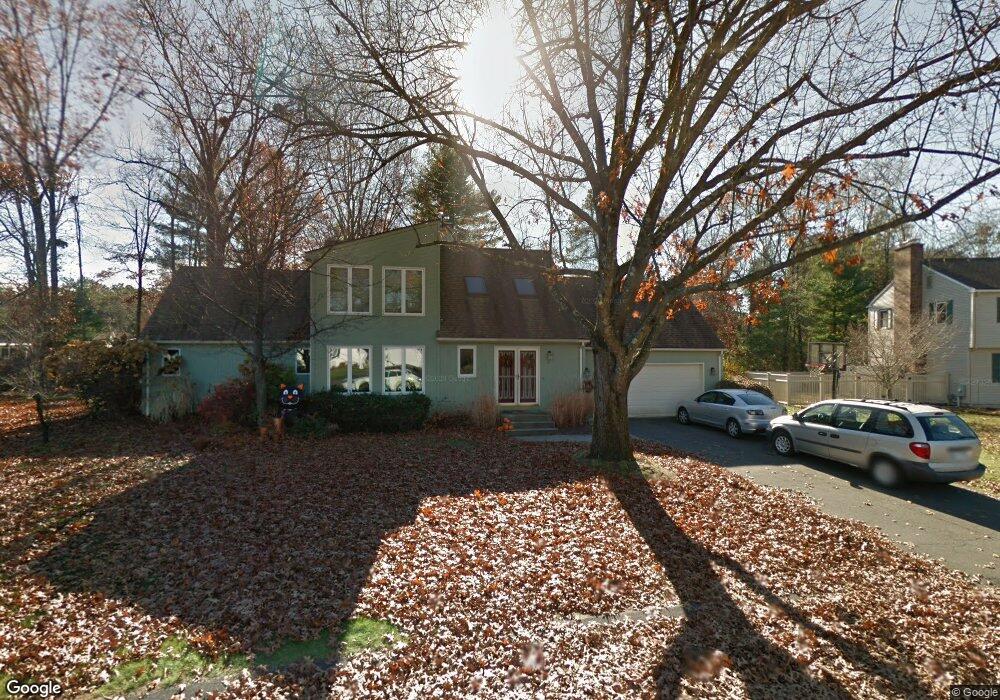
12 Golden Dr Easthampton, MA 01027
Estimated Value: $578,000 - $673,000
5
Beds
4
Baths
2,439
Sq Ft
$256/Sq Ft
Est. Value
About This Home
This home is located at 12 Golden Dr, Easthampton, MA 01027 and is currently estimated at $623,573, approximately $255 per square foot. 12 Golden Dr is a home located in Hampshire County with nearby schools including Easthampton High School, Calvary Baptist Christian School, and Tri-County Schools.
Ownership History
Date
Name
Owned For
Owner Type
Purchase Details
Closed on
Oct 8, 2003
Sold by
Landis Jill M
Bought by
Landis Jill M and Oppenheimer Lisa M
Current Estimated Value
Home Financials for this Owner
Home Financials are based on the most recent Mortgage that was taken out on this home.
Original Mortgage
$122,000
Outstanding Balance
$57,024
Interest Rate
6.35%
Mortgage Type
Purchase Money Mortgage
Estimated Equity
$566,549
Purchase Details
Closed on
Nov 8, 1996
Sold by
Wilson Robert P and Wilson Susan K
Bought by
Landis Jill M and Valenta Marcella A
Create a Home Valuation Report for This Property
The Home Valuation Report is an in-depth analysis detailing your home's value as well as a comparison with similar homes in the area
Home Values in the Area
Average Home Value in this Area
Purchase History
| Date | Buyer | Sale Price | Title Company |
|---|---|---|---|
| Landis Jill M | -- | -- | |
| Landis Jill M | $142,500 | -- | |
| Landis Jill M | -- | -- | |
| Landis Jill M | $142,500 | -- |
Source: Public Records
Mortgage History
| Date | Status | Borrower | Loan Amount |
|---|---|---|---|
| Open | Landis Jill M | $122,000 | |
| Closed | Landis Jill M | $122,000 |
Source: Public Records
Tax History Compared to Growth
Tax History
| Year | Tax Paid | Tax Assessment Tax Assessment Total Assessment is a certain percentage of the fair market value that is determined by local assessors to be the total taxable value of land and additions on the property. | Land | Improvement |
|---|---|---|---|---|
| 2025 | $7,956 | $582,000 | $136,000 | $446,000 |
| 2024 | $7,904 | $582,900 | $132,000 | $450,900 |
| 2023 | $5,167 | $352,700 | $104,200 | $248,500 |
| 2022 | $5,830 | $352,700 | $104,200 | $248,500 |
| 2021 | $6,416 | $365,800 | $104,200 | $261,600 |
| 2020 | $6,264 | $352,700 | $104,200 | $248,500 |
| 2019 | $5,563 | $359,800 | $121,500 | $238,300 |
| 2018 | $5,435 | $339,700 | $114,900 | $224,800 |
| 2017 | $5,299 | $326,900 | $110,200 | $216,700 |
| 2016 | $5,229 | $335,400 | $110,200 | $225,200 |
| 2015 | $5,081 | $335,400 | $110,200 | $225,200 |
Source: Public Records
Map
Nearby Homes