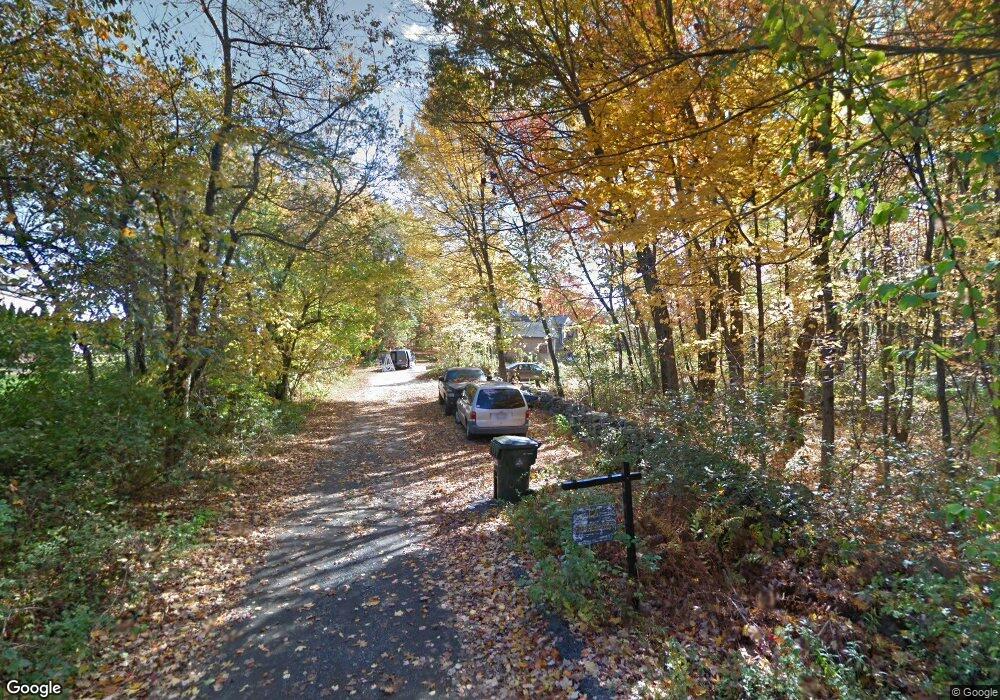
12 Green Rd Sutton, MA 01590
Estimated Value: $519,000 - $532,543
4
Beds
3
Baths
1,792
Sq Ft
$293/Sq Ft
Est. Value
About This Home
This home is located at 12 Green Rd, Sutton, MA 01590 and is currently estimated at $525,136, approximately $293 per square foot. 12 Green Rd is a home located in Worcester County with nearby schools including Sutton Elementary School, Sutton Middle School, and Sutton High School.
Ownership History
Date
Name
Owned For
Owner Type
Purchase Details
Closed on
Oct 20, 2005
Sold by
Wilkens Dennis and Tibbals Gail
Bought by
Willsey Glenn and Willsey Trecie Lee
Current Estimated Value
Home Financials for this Owner
Home Financials are based on the most recent Mortgage that was taken out on this home.
Original Mortgage
$240,000
Outstanding Balance
$128,135
Interest Rate
5.72%
Mortgage Type
Purchase Money Mortgage
Estimated Equity
$397,001
Purchase Details
Closed on
Jul 13, 2001
Sold by
Lamson Sally and Jahn Janet L
Bought by
Wilkens Dennis and Tibbals Leah
Home Financials for this Owner
Home Financials are based on the most recent Mortgage that was taken out on this home.
Original Mortgage
$147,250
Interest Rate
7.2%
Mortgage Type
Purchase Money Mortgage
Create a Home Valuation Report for This Property
The Home Valuation Report is an in-depth analysis detailing your home's value as well as a comparison with similar homes in the area
Home Values in the Area
Average Home Value in this Area
Purchase History
| Date | Buyer | Sale Price | Title Company |
|---|---|---|---|
| Willsey Glenn | $300,000 | -- | |
| Wilkens Dennis | $155,000 | -- |
Source: Public Records
Mortgage History
| Date | Status | Borrower | Loan Amount |
|---|---|---|---|
| Open | Willsey Glenn | $240,000 | |
| Previous Owner | Wilkens Dennis | $169,000 | |
| Previous Owner | Wilkens Dennis | $20,000 | |
| Previous Owner | Wilkens Dennis | $147,000 | |
| Previous Owner | Wilkens Dennis | $147,250 |
Source: Public Records
Tax History
| Year | Tax Paid | Tax Assessment Tax Assessment Total Assessment is a certain percentage of the fair market value that is determined by local assessors to be the total taxable value of land and additions on the property. | Land | Improvement |
|---|---|---|---|---|
| 2025 | $4,509 | $361,900 | $144,900 | $217,000 |
| 2024 | $4,161 | $322,800 | $124,900 | $197,900 |
| 2023 | $4,270 | $303,300 | $109,600 | $193,700 |
| 2022 | $4,246 | $273,600 | $110,700 | $162,900 |
| 2021 | $3,877 | $248,800 | $110,700 | $138,100 |
| 2020 | $3,259 | $240,500 | $110,700 | $129,800 |
| 2019 | $3,840 | $226,400 | $110,700 | $115,700 |
| 2018 | $2,492 | $219,500 | $110,700 | $108,800 |
| 2017 | $3,543 | $208,900 | $97,300 | $111,600 |
| 2016 | $3,583 | $208,900 | $97,300 | $111,600 |
| 2015 | $3,454 | $202,000 | $97,300 | $104,700 |
| 2014 | $3,507 | $201,100 | $102,400 | $98,700 |
Source: Public Records
Map
Nearby Homes
- 90 Leland Hill Rd
- 191 Hartness Rd
- 5 Wildflower Dr
- 53 Fisherville Terrace
- 58 Fisherville Terrace
- 64 Fisherville Terrace
- 62 Fisherville Terrace
- 82 Central Turnpike
- 7 Central Turnpike
- 20 Millers Way Unit C
- 175 Armsby Rd
- 66 Buttonwood Ave
- 56 Luka Dr Unit 56
- 150 Ariel Cir
- 229 Worcester-Providence Turnpike
- 51 Lincoln Rd
- 220 Alana Dr
- 86 Mikes Way Unit 86
- 9 Danielle Dr
- 20 Wunschel Dr
- 5 Brookside Dr
- 3 Brookside Dr
- 3 Brookside Dr Unit 1
- 7 Peach Tree Dr
- 5 Boundary Stone Rd
- 3 Boundary Stone Rd
- 4 Brookside Dr
- 9 Peach Tree Dr
- 142 Hartness Rd
- 8 Brookside Dr
- 8 Peach Tree Dr
- 9 Boundary Stone Rd
- 12 Brookside Dr
- 148 Hartness Rd
- 3 Green Rd
- 153 Hartness Rd
- 4 Boundary Stone Rd
- 136 Hartness Rd
- 67 Leland Hill Rd
- 11 Peach Tree Dr
Your Personal Tour Guide
Ask me questions while you tour the home.