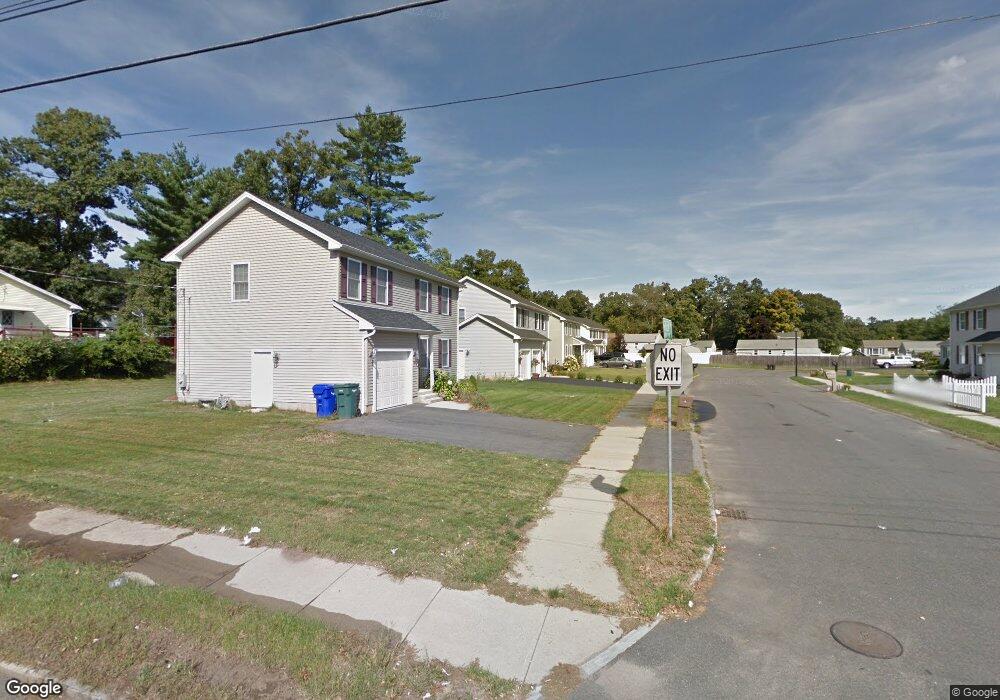
12 Green Way Unit 5 Springfield, MA 01118
East Forest Park NeighborhoodEstimated Value: $357,000 - $425,000
3
Beds
3
Baths
1,700
Sq Ft
$228/Sq Ft
Est. Value
About This Home
This home is located at 12 Green Way Unit 5, Springfield, MA 01118 and is currently estimated at $387,054, approximately $227 per square foot. 12 Green Way Unit 5 is a home located in Hampden County with nearby schools including Frederick Harris Elementary School, M Marcus Kiley Middle, and Springfield High School of Science and Technology.
Ownership History
Date
Name
Owned For
Owner Type
Purchase Details
Closed on
Dec 28, 2018
Sold by
Donoghue Myles D
Bought by
Nelson Shawna
Current Estimated Value
Home Financials for this Owner
Home Financials are based on the most recent Mortgage that was taken out on this home.
Original Mortgage
$243,470
Outstanding Balance
$215,343
Interest Rate
4.9%
Mortgage Type
New Conventional
Estimated Equity
$171,711
Purchase Details
Closed on
Nov 13, 2009
Sold by
Moltenbrey John and Roosevelt Hill Llc
Bought by
Donoghue Myles D
Home Financials for this Owner
Home Financials are based on the most recent Mortgage that was taken out on this home.
Original Mortgage
$223,378
Interest Rate
4.98%
Mortgage Type
Purchase Money Mortgage
Create a Home Valuation Report for This Property
The Home Valuation Report is an in-depth analysis detailing your home's value as well as a comparison with similar homes in the area
Home Values in the Area
Average Home Value in this Area
Purchase History
| Date | Buyer | Sale Price | Title Company |
|---|---|---|---|
| Nelson Shawna | $251,000 | -- | |
| Donoghue Myles D | $227,500 | -- |
Source: Public Records
Mortgage History
| Date | Status | Borrower | Loan Amount |
|---|---|---|---|
| Open | Nelson Shawna | $243,470 | |
| Previous Owner | Donoghue Myles D | $223,378 |
Source: Public Records
Tax History
| Year | Tax Paid | Tax Assessment Tax Assessment Total Assessment is a certain percentage of the fair market value that is determined by local assessors to be the total taxable value of land and additions on the property. | Land | Improvement |
|---|---|---|---|---|
| 2025 | $5,560 | $354,600 | $51,500 | $303,100 |
| 2024 | $5,801 | $361,200 | $51,500 | $309,700 |
| 2023 | $5,354 | $314,000 | $49,000 | $265,000 |
| 2022 | $5,159 | $274,100 | $49,000 | $225,100 |
| 2021 | $5,128 | $271,300 | $44,600 | $226,700 |
| 2020 | $4,908 | $251,300 | $44,600 | $206,700 |
| 2019 | $4,794 | $243,600 | $44,600 | $199,000 |
| 2018 | $4,467 | $243,300 | $44,600 | $198,700 |
| 2017 | $4,467 | $227,200 | $44,600 | $182,600 |
| 2016 | $4,250 | $216,200 | $44,600 | $171,600 |
| 2015 | $4,021 | $204,400 | $44,600 | $159,800 |
Source: Public Records
Map
Nearby Homes
- 55 Allen St
- 101 Regal St
- 19 Manor Ct Unit 19
- 120 Bridle Path Rd
- 17 Pebble Mill Rd
- 125 Manor Ct Unit 125
- 86 Talmadge Dr
- 647 Plumtree Rd
- 85 Talmadge Dr
- 24 Wands St
- 509 Plumtree Rd
- 206 Treetop Ave
- 37 Chesterfield Ave
- 81 W Crystal Brook Dr
- 41 Hillside Dr
- 86 Wildwood Ave
- 46 Hadley St
- 119 Powell Ave
- 75 Gillette Cir
- 79 Arvilla St
Your Personal Tour Guide
Ask me questions while you tour the home.