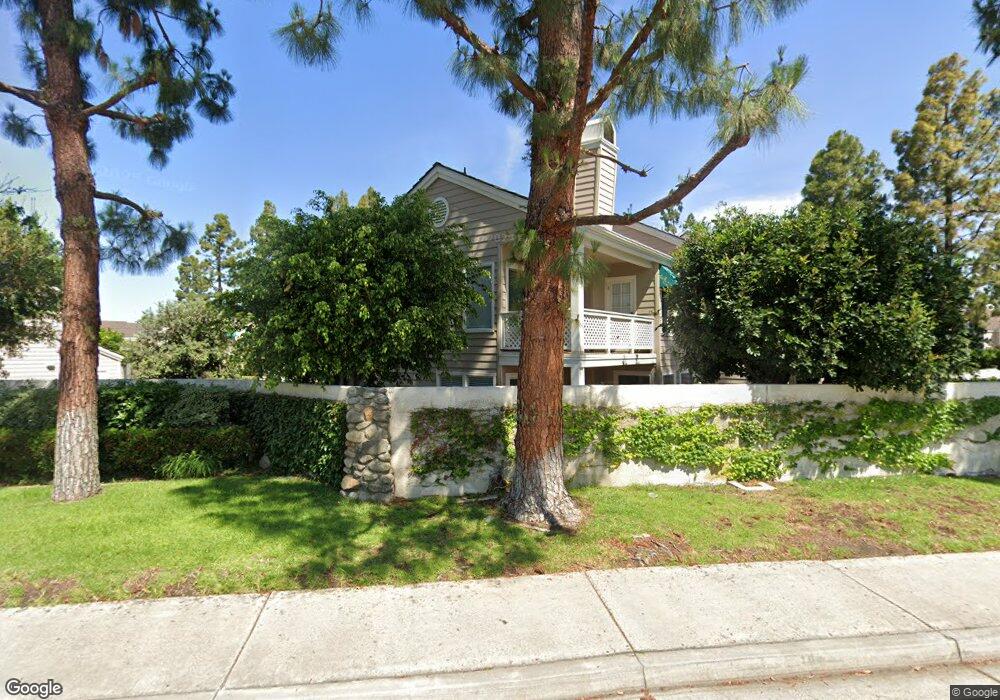
12 Harborcrest Unit 46 Irvine, CA 92604
Woodbridge NeighborhoodEstimated Value: $1,413,000 - $1,680,000
3
Beds
3
Baths
2,233
Sq Ft
$702/Sq Ft
Est. Value
About This Home
This home is located at 12 Harborcrest Unit 46, Irvine, CA 92604 and is currently estimated at $1,566,463, approximately $701 per square foot. 12 Harborcrest Unit 46 is a home located in Orange County with nearby schools including Eastshore Elementary School, Lakeside Middle School, and Woodbridge High School.
Ownership History
Date
Name
Owned For
Owner Type
Purchase Details
Closed on
Jan 26, 2024
Sold by
Ahn Kimberly and Ahn Reynaldo C
Bought by
Perez Ahn Trust and Perez
Current Estimated Value
Purchase Details
Closed on
Jan 22, 2007
Sold by
Ahn Kimberly and Perez Reynaldo C
Bought by
Perez Reynaldo C and Ahn Kimberly
Home Financials for this Owner
Home Financials are based on the most recent Mortgage that was taken out on this home.
Original Mortgage
$534,000
Interest Rate
6.1%
Mortgage Type
New Conventional
Purchase Details
Closed on
Jul 29, 2005
Sold by
Ahn Kimberly
Bought by
Perez Renaldo C and Ahn Kimberly
Home Financials for this Owner
Home Financials are based on the most recent Mortgage that was taken out on this home.
Original Mortgage
$249,900
Interest Rate
5.56%
Mortgage Type
Credit Line Revolving
Create a Home Valuation Report for This Property
The Home Valuation Report is an in-depth analysis detailing your home's value as well as a comparison with similar homes in the area
Home Values in the Area
Average Home Value in this Area
Purchase History
| Date | Buyer | Sale Price | Title Company |
|---|---|---|---|
| Perez Ahn Trust | -- | None Listed On Document | |
| Perez Reynaldo C | -- | First American Title Co | |
| Perez Renaldo C | -- | First American Title Co |
Source: Public Records
Mortgage History
| Date | Status | Borrower | Loan Amount |
|---|---|---|---|
| Previous Owner | Perez Reynaldo C | $534,000 | |
| Previous Owner | Perez Renaldo C | $249,900 |
Source: Public Records
Tax History
| Year | Tax Paid | Tax Assessment Tax Assessment Total Assessment is a certain percentage of the fair market value that is determined by local assessors to be the total taxable value of land and additions on the property. | Land | Improvement |
|---|---|---|---|---|
| 2025 | $7,947 | $753,415 | $433,981 | $319,434 |
| 2024 | $7,947 | $738,643 | $425,472 | $313,171 |
| 2023 | $7,743 | $724,160 | $417,129 | $307,031 |
| 2022 | $7,596 | $709,961 | $408,950 | $301,011 |
| 2021 | $7,423 | $696,041 | $400,932 | $295,109 |
| 2020 | $7,382 | $688,904 | $396,820 | $292,084 |
| 2019 | $7,218 | $675,397 | $389,040 | $286,357 |
| 2018 | $7,092 | $662,154 | $381,411 | $280,743 |
| 2017 | $6,947 | $649,171 | $373,932 | $275,239 |
| 2016 | $6,641 | $636,443 | $366,600 | $269,843 |
| 2015 | $6,542 | $626,884 | $361,094 | $265,790 |
| 2014 | $6,416 | $614,605 | $354,021 | $260,584 |
Source: Public Records
Map
Nearby Homes
- 35 Firwood
- 16 Driftwood Unit 24
- 29 Sandstone
- 36 Sunfish Unit 41
- 36 Bloomdale
- 3 Park Vista
- 125 Briarglen
- 17 Clove Blossom
- 81 Briarglen
- 8 Sandpiper
- 8 Firebird Unit 78
- 9 Flaxwood
- 95 Wildwood Unit 40
- 18 Brookdale
- 13 Shooting Star
- 65 Pinewood Unit 33
- 57 Pinewood Unit 29
- 12 Oakdale
- 16 Woodpine Dr
- 527 Springbrook N
- 10 Harborcrest
- 14 Harborcrest Unit 45
- 14 Harborcrest
- 8 Harborcrest
- 16 Harborcrest Unit 44
- 6 Harborcrest Unit 58
- 9 Harborcrest
- 7 Harborcrest Unit 48
- 11 Harborcrest Unit 41
- 15 Harborcrest Unit 42
- 15 Harborcrest
- 1 Alderberry
- 17 Harborcrest Unit 43
- 17 Harborcrest
- 4 Harborcrest
- 2 Alderberry Unit 15
- 2 Alderberry
- 5 Harborcrest Unit 56
- 3 Alderberry Unit 7
- 4 Alderberry Unit 14
Your Personal Tour Guide
Ask me questions while you tour the home.